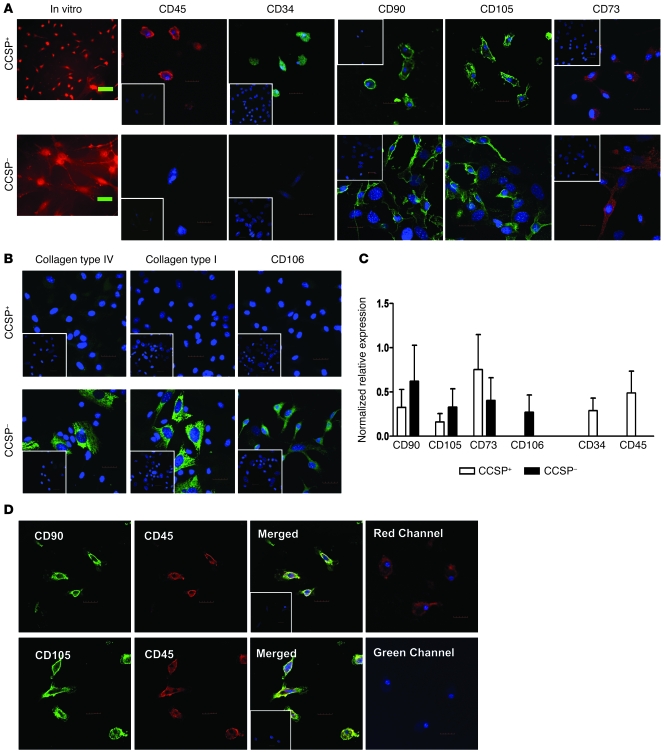
Figure 2. Characterization of the Ccsp+ BMC population.
(A) Morphologically, Ccsp+ and Ccsp– cells were distinguishable in vitro. Ccsp+ cells were smaller, rounder cells, while Ccsp– cells were larger, with more cytoplasmic extensions. Ccsp+ cells expressed pan-hematopoietic marker CD45 and progenitor marker CD34. Both Ccsp+ and Ccsp– cells expressed the MSC markers CD73, CD90, and CD105. (B) Ccsp+ cells did not express the MSC markers CD106, type I collagen, or type IV collagen. Some Ccsp– cells expressed CD106, type IV collagen, and type I collagen. Insets are representative isotype staining controls. (C) Real-time PCR showed gene expression of some MSC markers (CD90, CD105, CD73) in Ccsp+ cells but not CD106. Hematopoietic genes CD45 and CD34 were also detected in Ccsp+ cells. Conversely, Ccsp– cells expressed all mesenchymal stromal cell genes but no hematopoietic genes. GAPDH was used as housekeeping gene for normalization of expression levels. Each bar represents normalized relative levels compared with MSCs (bone marrow nonadherent cells for CD45 and CD34). n = 4 sets of cells from 4 different animals. (D) Most Ccsp+ cells coexpressed both hematopoietic (CD45) and mesenchymal markers (CD90 and CD105). Control staining with CD45-PE (red) and secondary antibody specific for CD90/CD105 showed no cross-reactivity of the secondary antibody binding to CD45 primary antibody (no fluorescence in the green channel). Mixed isotypes were used as a control for nonspecificity of the primary antibody (inset). Hoechst counterstain was used to visualize nuclei (blue). All scale bars: 20 μm. Original magnification, ×20.

