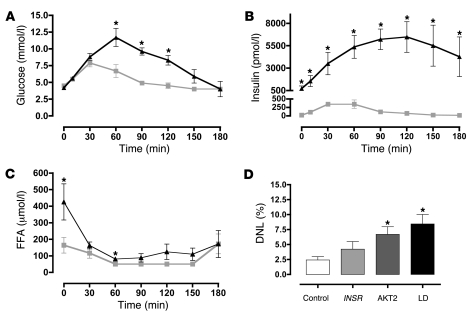
Figure 3. Metabolic phenotyping of patients with insulin receptor mutations.
(A–C) Plasma glucose (A), insulin (B), and non-esterified FFAs (C) before and after a 75-g oral glucose challenge in patients (n = 4) with type A insulin resistance due to insulin receptor mutations (filled triangles) and in healthy controls (n = 6; gray squares). (D) De novo lipogenesis (DNL) in healthy controls (n = 6; white bar) and in patients with severe insulin resistance due to mutations in the insulin receptor (INSR; n = 4; light gray bar), AKT2 (n = 2; dark gray bar) or partial lipodystrophy (LD; n = 3; black bar). All data represent mean ± SEM. *P < 0.05 versus control.

