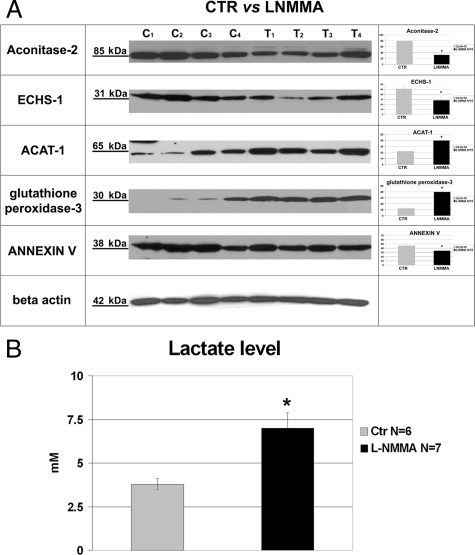
Figure 3.
Validation of the DIGE results: Western blot analysis of selected proteins. A: Representative Immunodetection of mitochondrial aconitase-2, ECHS-1, ACAT-1, glutathione peroxidase-3, and Annexin-V in individual microvascular trees of control (C1–C4) and L-NMMA-treated mice (T1–T4). Accordingly with 2D-DIGE, treated animals showed a reduced abundance of mitochondrial Aconitase-2 (80.8 ± 7.4 vs. 33.8 ± 6.1, controls versus L-NMMA treated respectively), ECHS-1 (51.9 ± 8.2 vs. 28.8 ± 6.2), and Annexin-V (47.2 ± 5.0 vs. 32.6 ± 5.9). Analysis showed an increased abundance of ACAT-1 (23.7 ± 5.0 vs. 39.4 ± 4.6) and Glutathione peroxidase 3 (12.2 ± 2.4 vs. 40.6 ± 4.4). Right-hand bar diagrams summarize densitometric analysis of individual proteins normalized for β-Actin abundance (N = 10 samples per group). Values are expressed in arbitrary units as means ± SD. *P < 0.05 vs. control. B: Lactate level in control and L-NMMA-treated mice. *P < 0.05 vs. control.

