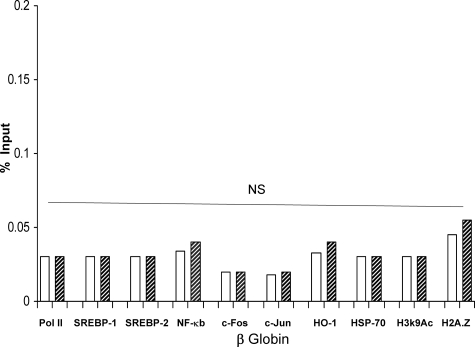
Figure 7.
Assessments performed at the β-globin gene. As additional controls for the experiments depicted in Figures 1 to 5 and Figure 7, the SREBPs, general transcription factors, heat shock proteins, and histone modifications/variants were assessed at the normally silent β-globin gene (assessed between exon 1 and intron 1). In no instance was a statistically significant difference observed between control and the I/R kidney samples. Not shown (because of a different y axis scale), the amount of H3K4m3 was also not increased by I/R (2.2% versus 2.5% input for control and I/R samples; NS).

