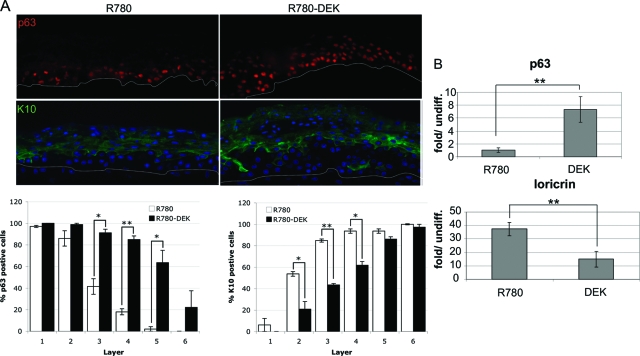
Figure 4.
DEK overexpression inhibits the normal differentiation program. A: Immunofluorescence microscopy. Raft sections were incubated with p63 or K10 primary antibodies followed by incubation with secondary rhodamine or fluorescein isothiocyanate-conjugated secondary antibody. Sections were counterstained with DAPI and images were captured using an immunofluorescence microscope. Positive cells were quantitated for each cell layer in two independent experiments and were averaged; SE is depicted. *P < 0.05, **P < 0.01. B: Quantitative RT-PCR. NIKs containing control or DEK expressing retrovirus were submerged in 1.5% methylcellulose to induce differentiation for 24 hours. Cells were harvested for RNA isolation and equal amounts of RNA were reverse transcribed and amplified quantitatively using SYBR green for detection. Levels of cDNA in each sample were calculated relative to the levels of c-abl, and fold mRNA levels are shown for differentiated relative to the respective undifferentiated cell populations. Real time RT-PCR data were derived from four independent experiments, SE is shown **P < 0.01.

