Figure 5.
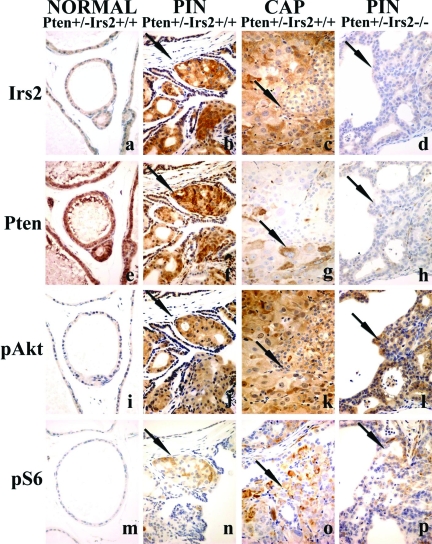
PI3K pathway components and signaling in PIN lesions. Immunoperoxidase staining of adjacent sections for Irs2 (a–d), Pten (e–h), pAkt (phosphoserine 473) (i–l), and pS6 (phosphoserines 235 and 236) (m–p) of prostates of Pten+/− transgenic mice focusing on nonneoplastic tissue (NORMAL) (a, e, i, m), PIN (b, f, j, n), or CAP (c, g, k, o) of Pten+/−Irs2+/+ mice or PIN of Pten+/−Irs2−/− mice (d, h, l, p); the latter did not develop CAP. The nonneoplastic tissue is stained weakly (negative) for Irs2 (a), strongly positive for Pten (e), and negative for pAkt (i) and pS6 (m) suggesting quiescent PI3K signaling. Irs2 is up-regulated in both PIN (arrow in b) and CAP (arrow in c), whereas Pten staining gradually decreases in PIN (arrow in f indicates positive cells) and is virtually absent in CAP (arrow in g indicates positive cell) in Pten+/−Irs2+/+ mice together with significant up-regulation of PI3K signaling with high levels of pAkt (j, k) and pS6 (n, o) in PIN and CAP. PIN of Pten+/−Irs2−/− mice (see negative Irs2 labeling in d) shows significantly more Pten loss (arrow in h, see also Figure 4D) than the Pten+/−Irs2+/+ controls (f). Compared to normal, however, pAkt (l) and pS6 (p) levels in PIN of Pten+/−Irs2−/− mice are still elevated. Arrows in d, h, l and p show PIN in Pten+/−Irs2−/− mice. Arrows (b, f, j, n) show PIN and prostate carcinoma (c, g, k, o) in Pten+/−Irs2+/+. Original magnifications, ×400.

