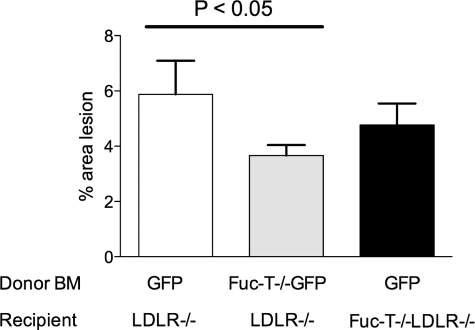
Figure 3.
Quantification of total aortic lesion area stained positive for Sudan IV in LDLR−/− mice receiving GFP+ marrow (white bar), LDLR−/− mice receiving FucT-VII−/−GFP+ marrow (gray bar), and FucT-VII−/−LDLR−/− mice receiving GFP+ marrow (black bar) fed a high-fat diet for 12 weeks. Data are reported as percent lesion area compared to the total aortic surface area for each animal. The mean ± SEM is shown for each group.

