Figure 4.
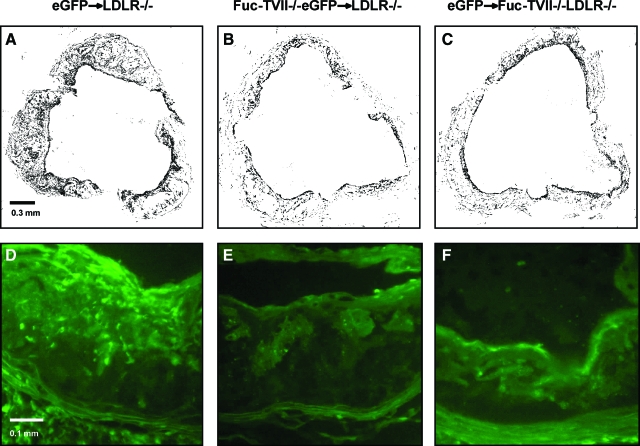
Representative photomicrographs of aortic heart valve sections from LDLR−/− mice receiving FucT-VII−/−GFP+ marrow (A, D), LDLR−/− mice receiving GFP+ marrow (B, E), and FucT-VII−/−LDLR−/− mice receiving GFP+ marrow (C, F) fed a high-fat diet for 12 weeks. A–C: Black areas representing regions of MOMA-2-positive macrophage staining. The black color represents MOMA-2-positive areas that were selected and highlighted using PhotoShop outfitted with Chroma filter. This was done to demonstrate clearly the macrophages in the lesions. D–F: Representative examples of eGFP-positive cells in the aortic root lesions to demonstrate the accumulation of bone marrow-derived mononuclear cells in atherosclerosis. Original magnifications: ×100 (A–C); ×250 (D–F).

