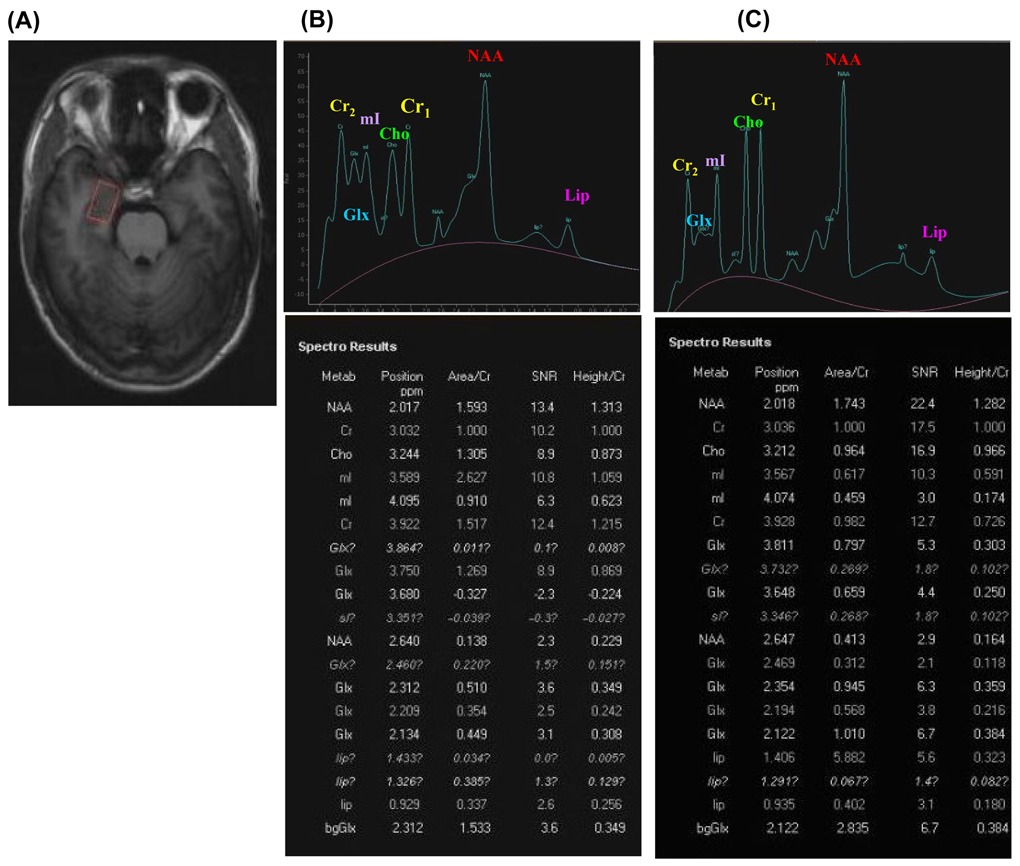
Fig. 3. 1H-MRS.
Representative hippocampal 1H-MRS spectra (STEAM sequence) of study participants. (A) An MRI indicates the position of MRS sequence. (B) A typical MRS spectra of a healthy volunteer is shown along with the original record of peak position, area/Cr and height/Cr of studied metabolites. (C) A typical MRS spectra of a Pb-exposed worker is shown along with the original record of MRS results.

