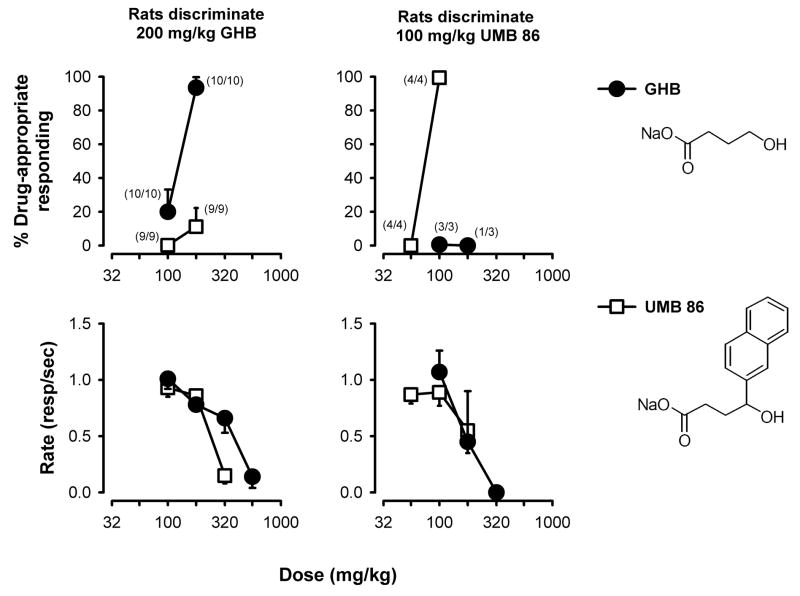
Figure 2.
Effects of GHB and the GHB receptor ligand UMB 86 in rats discriminating GHB or UMB 86. The percentage of responses on the drug-appropriate lever (top panels) and the rate of responding (responses/sec; bottom panels) are plotted as a function of dose. Data points and error bars represent the mean ± 1 S.E.M. for 9 or 10 animals discriminating GHB from vehicle (left panels; replotted from Carter et al., 2005b) or for 3 or 4 animals discriminating UMB 86 from vehicle (right panels). The number of animals contributing to each data point in the top panels in given in the numerator adjacent to each point. The structures of the compounds studied are shown on the right-hand side of the figure.

