
Figure 1.
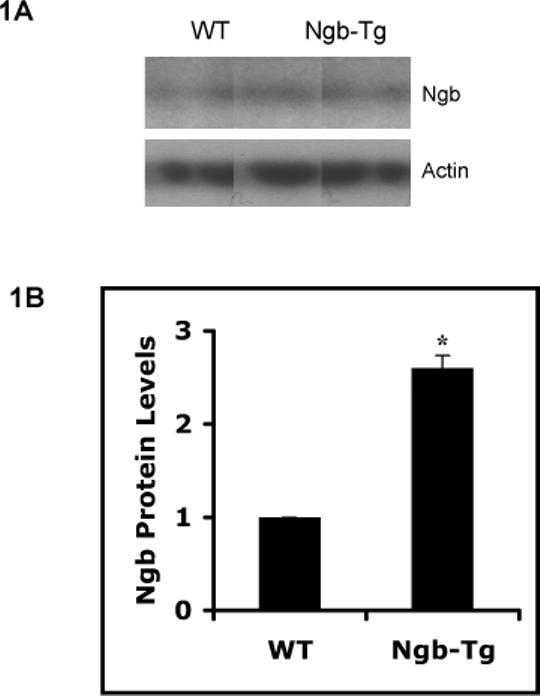
Increase of Ngb protein expression in Ngb-Tg cortical neuron cultures. A. Representative western blot showed Ngb-Tg neurons had higher Ngb protein levels compared to WT controls. Actin served as equal loading controls. B. Relative Ngb protein expression levels were quantified by optical density of Ngb protein bands. Mean±SEM, n=3 per group, *P<0.05.