
Figure 3.

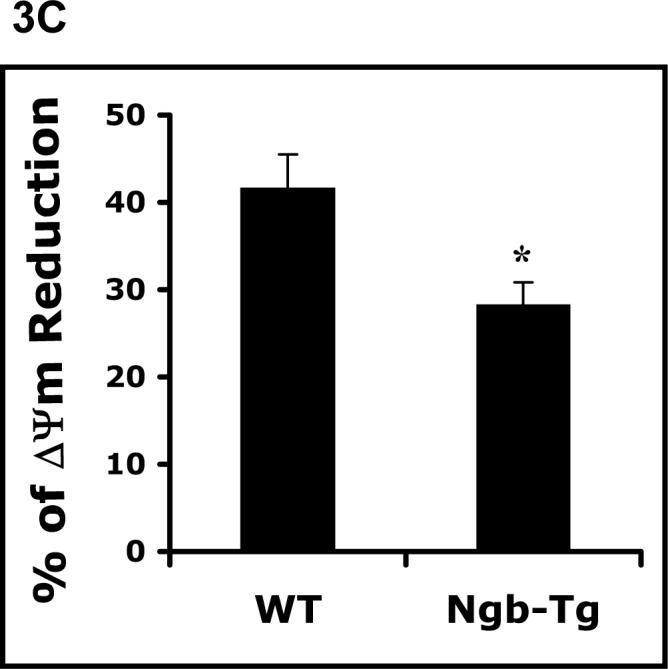
Amelioration of mitochondrial disruption in Ngb over-expressing neurons after H/R. A. Time-course of ATP levels was examined after hypoxia 10 hrs (H10), and followed by repxygenation for 2 hrs and 6 hrs. Levels of ATP in Ngb-Tg neurons were significantly higher at all three time points compared with WT neurons. B. Time- course of MTT reduction was measured after hypoxia 10 hrs followed by reoxygenation for 2 hrs (H10/R2), and 6 hrs (H10/R6). MTT reduction in Ngb-Tg neurons were significantly increased at the two time points compared with WT neurons. Mean±SEM, n=4, *p<0.05. C. ΔΨm was measured after 10 hr hypoxia followed by 2 hr reoxygenation, the ΔΨm reduction rate in Ngb-Tg neurons was significantly inhibited compared to WT controls. Mean±SEM, n=10 per group, *p<0.05.