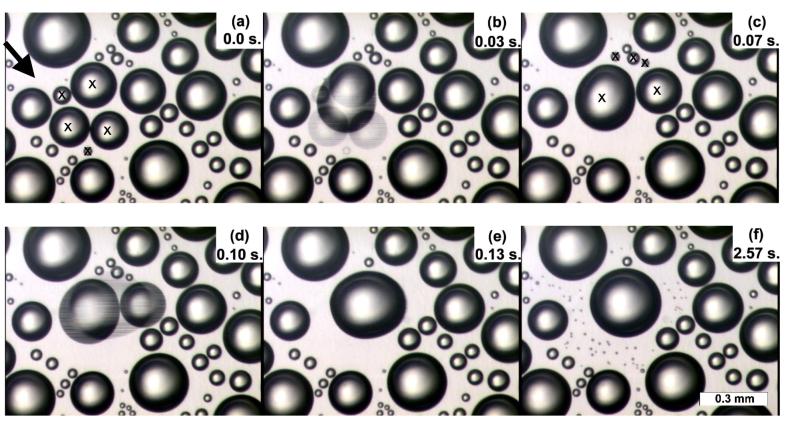
Fig. 3.
Video images of water drops on Saran® over water initially at 97°C. (a) Drops prior to coalescence; the drops to coalesce are marked with x’s. The arrow identifies a drop-free region where drops will be observed later. Time t = 0 corresponds to the acquisition of this image. (b) The same region during coalescence. (c) The next image, where drops to coalesce are marked with x’s. (d) The same region during coalescence and (e) after coalescence. (f) The same region seconds later, after newly nucleated drops become visible following coalescence. Some of these drops appear in the region marked in (a), which was drop-free prior to the coalescence events.

