
Figure 1.
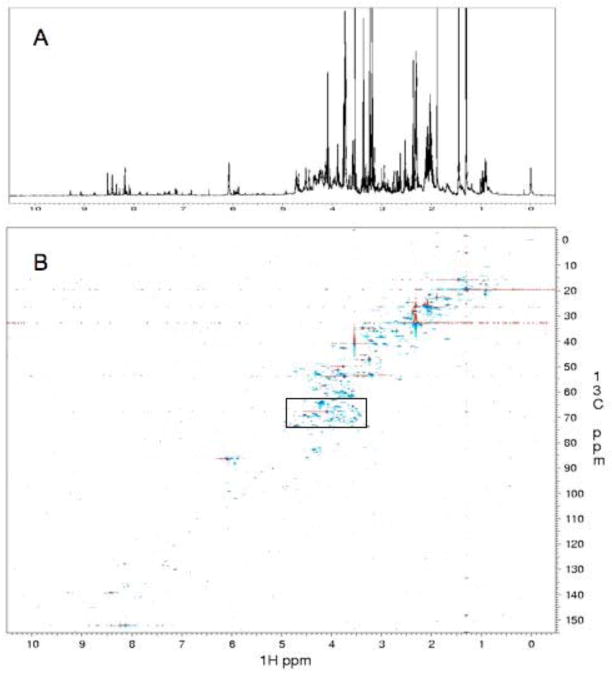
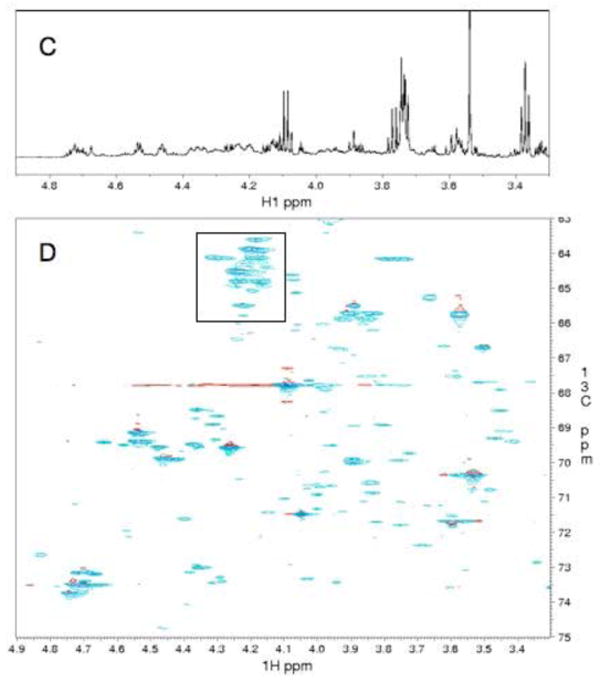
NMR spectra of the aqueous fraction of cell extracts from mouse BaF3 cells in 2H2O, pH 6.5, 25° C. A. One-dimensional 1H NMR spectrum. B. 1H-13C HSQC spectrum recorded with 4k complex points in the indirect dimension. C and D. Expansion of the section indicated with the box in B and corresponding 1D spectrum. Note that the 2D spectrum of Fig. 1C is a small portion of the entire spectrum. The 1D spectrum of Figure 1C contains also signals from outside the 13C region of Fig. 2D (compare Fig. 1A and 1B).