
Figure 3.
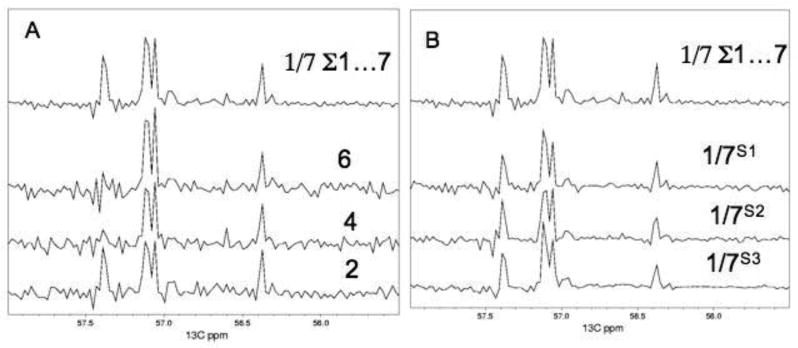
Comparison of representative cross sections along the 13C direction at a proton frequency of 3.76 ppm. (A) Use of the full linearly sampled data. The bottom three traces are from the full linearly sampled data sets 2, 4 and 6. The top trace is from the average of all seven linearly sampled data sets (sum of all seven spectra divided by 7). (B) The top trace is the same as in A. The three traces at the bottom, however, are obtained by selecting 1/7th of the increments of the averaged data set and transformed with FM reconstruction. In the sampling schedule S1 1/7th of the increments were picked randomly from the averaged data set with equal density along t1. In schedule S2, 1/7th of the increments were picked with exponentially decreasing density, and in schedule S3, 1/7th of the increments were picked with linearly decreasing density. Note that the peak at 57.35 ppm disappears with time and is only visible in spectra 1 – 3. Although we tried to stabilize the metabolite samples some peaks change over a period of 3.7 days. Thus, the spectra 2, 4 and 6 are not entirely identical.