
Fig. 6.
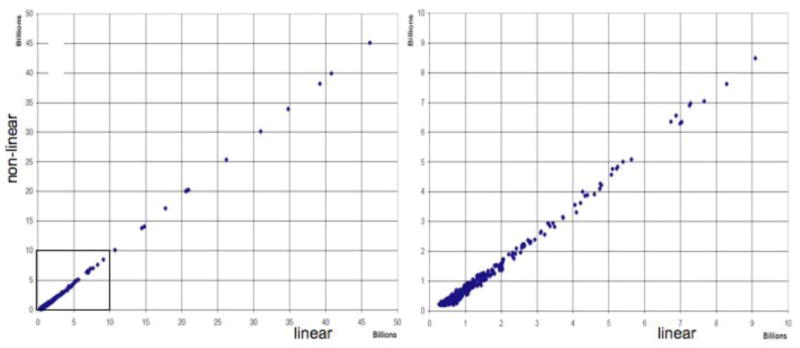
Comparison of peak heights between the linearly sampled 3.7-day experiment (horizontal) and the randomly sampled 12.7-hour experiment (vertical). The latter provides a high-fidelity reproduction of the peak heights in the full linearly sampled spectrum. Left: total range of peak heights of peaks. The region shown in the expansion on the right is indicated with a box. Right: expansion of the section containing weak peaks. Peaks were measured if they were larger than approximately 0.2 × 10⁹, which is approximately twice the amount of peak noise (see Fig. 5). Note that the values for the non-linearly sampled data are lower than those of the linearly sampled spectra by a constant offset of approximately the value of the peak noise.