
Figure 2.
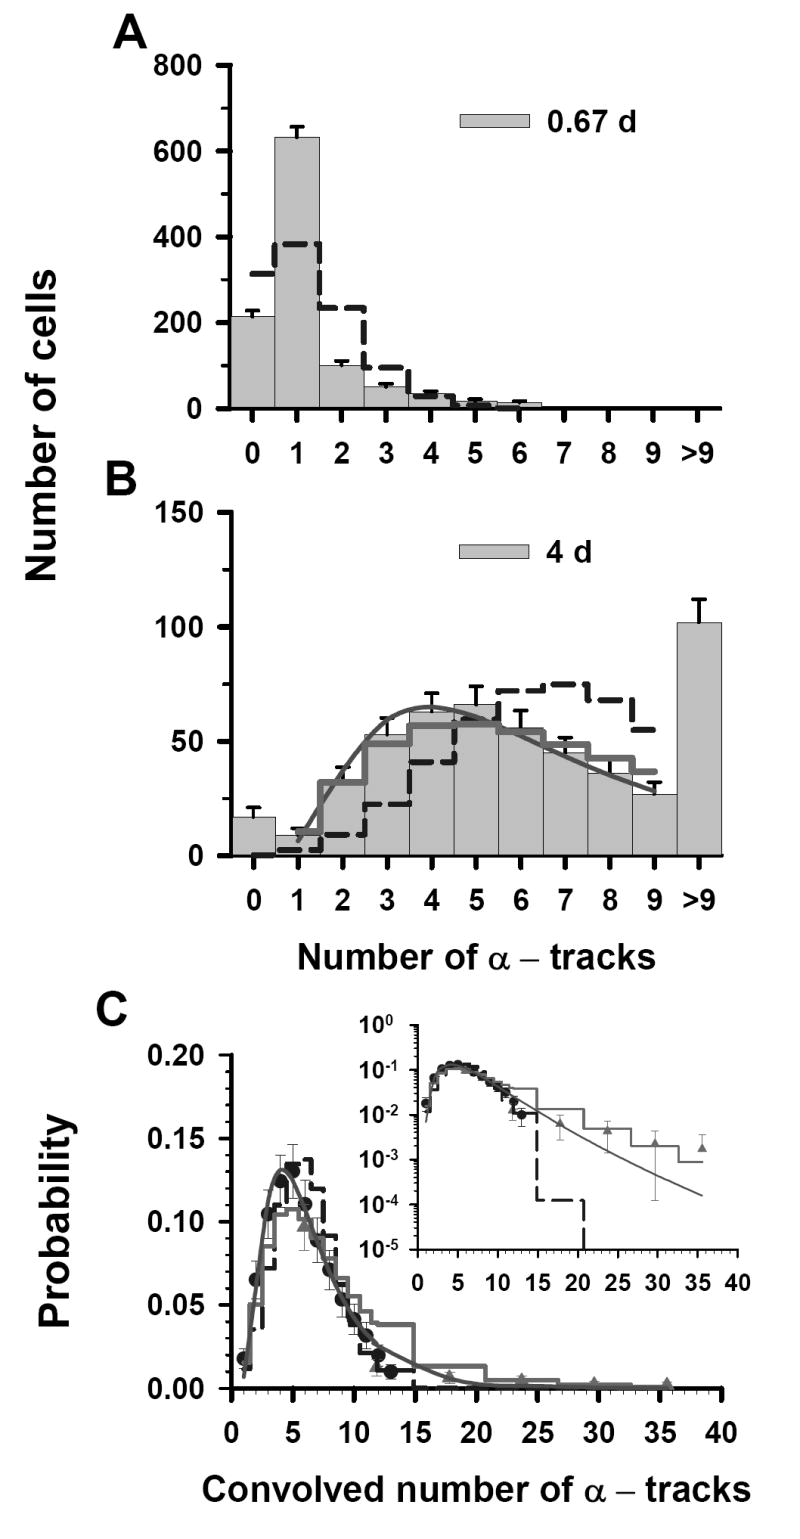
Statistical analysis of α-particle track distribution in V79 lung fibroblasts that were labeled in culture medium containing 3.8 kBq/mL 210Po-citrate. Decays were allowed to accumulate for 0.67 d (A) and 4 d (B). The data points in Panel C represent a normalized convolution of the experimental track data obtained at 0.67 d (▲) and 26 d (●). Error bars, dashed step line, thick solid step line, solid curve and the inset are all as explained in Fig. 1. The parameters of the three probability density functions are also enumerated in Table 1.