
Figure 4.
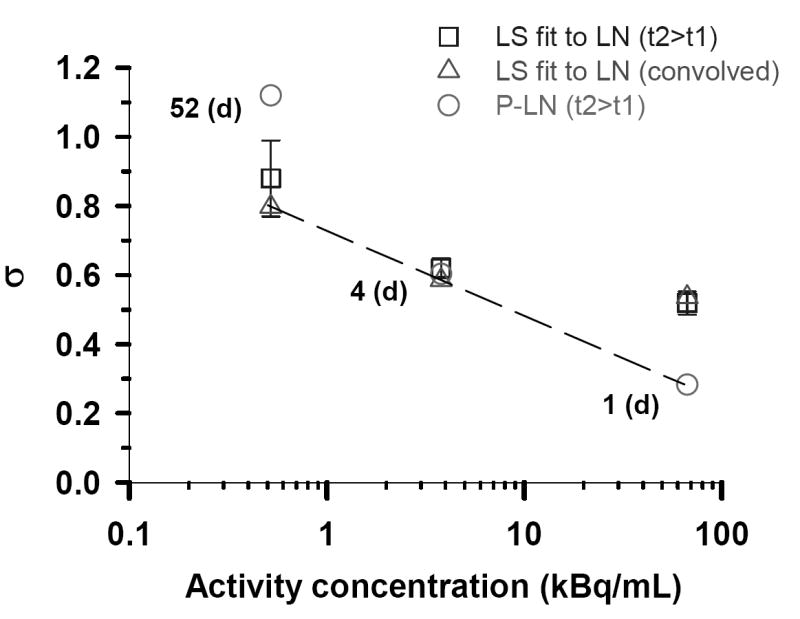
Log normal shape parameters (σ) for the three different activity concentrations of 210Po-citrate. The open squares (□) represent the values of σ obtained, when <n> was constrained, by least squares fits of the experimental track data corresponding to the longest decay accumulation times (i.e. t2>t1, Figs. 1C, 2B, 3B) to a LN distribution function. Standard errors of these fitted σ values are indicated by the vertical lines. The corresponding σ values obtained for these same data using the P–LN distribution function are shown as open circles (○). The open triangles (△) correspond to least squares fits of the convolved data (Figs. 1D, 2C, 3C) to the LN function. Finally, the dashed line passes through what are considered the best σ values as defined by the lowest χ̂2.