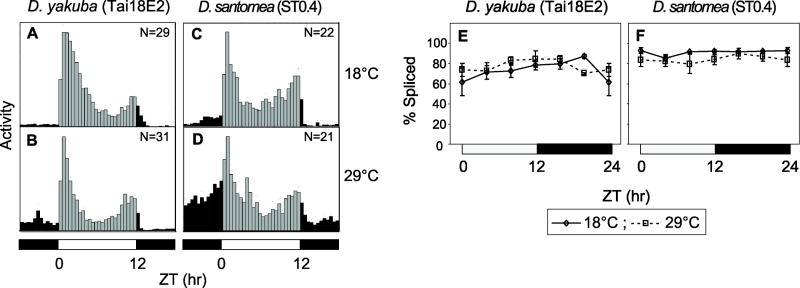
Figure 8. Little to no thermal response in the daily activity profile and splicing efficiency of the dsanp3’ intron in D. santomea.
(A-D) Histograms represent the distribution of locomotor activity for D. yakuba (Tai18E2) and D. simulans (ST0.4) flies during 12:12LD cycles at the indicated temperatures. The number of flies used to generate the daily activity profiles is shown in the panels. Black and gray vertical bars (30-min bins) indicate relative activity levels during the light and dark periods, respectively. (E, F) Splicing efficiency of dyp3’ (E) and dsanp3’ (G) introns in D. yakuba and D. santomea, respectively. ANOVA analysis revealed no significant effect of temperature on the splicing efficiencies of either dyp3’ or dsanp3’ introns (P>0.01). White and black horizontal bars; 12hr light, 12hr dark periods, respectively. Results from at least two independent experiments were averaged.

