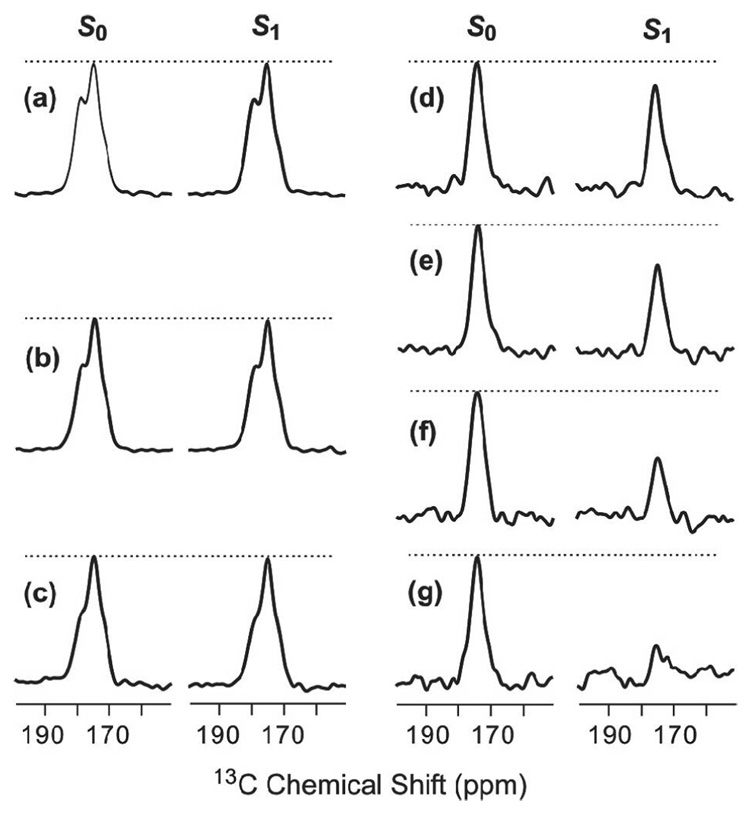
Figure 1.
13CO-31P REDOR spectra of (a–c) lyophilized HFP2-11FLG and (d–g) the HFP4:DPPC-13C sample. The left and right spectra in each pair of 13C-detected spectra are S0 and S1 spectra, respectively. The dotted lines are drawn for visual comparison of S0 and S1 peak intensities. Each spectrum was processed with 200 Hz Gaussian line broadening and baseline correction. The τ values and numbers of S0 or S1 scans in each pair of spectra were: a, 1 ms, 120; b, 11 ms, 126; c, 19 ms, 138; d, 1 ms, 8; e, 7 ms, 56; f, 13 ms, 104; g, 19 ms, 152.

