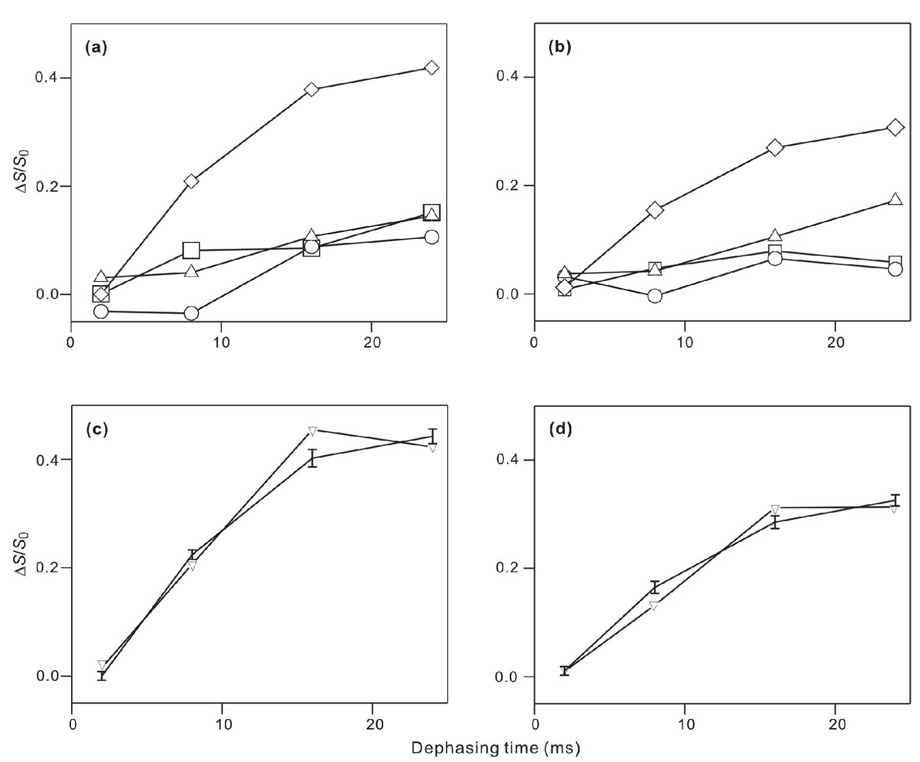
Figure 5.
(ΔS/S0) vs dephasing time for membrane-associated HFP in (a,c) PC:PG or (b,d) PC:PG:CHOL. For panels a and b, the points correspond to (ΔS/S0)exp and the symbol legend is: squares, HFP2-5GAL; circles, HFP3-8FLG; up triangles, HFP2-11FLG; and diamonds, HFP2-14AAG. The vertical dimensions of each symbol approximately correspond to the ±1 σ uncertainty limits. Lines are drawn between (ΔS/S0)exp values with adjacent values of τ. Each (ΔS/S0)exp value was determined by integration of 10 ppm regions of the S0 and S1 spectra. Panels c and d respectively correspond to the HFP2-14AAG/PC:PG and the HFP2-14AAG/PC:PG:CHOL samples and the points correspond to (ΔS/S0)lab (vertical lines with error bars) and best-fit (ΔS/S0)sim (down triangles). Lines are drawn between points with adjacent τ values. For plot c, the best-fit d = 91 ± 8 Hz with corresponding r = 5.12 ± 0.16 Å, f = 0.45 ± 0.02, and χ2min = 5.0. For plot d, the best-fit d = 85 ± 6 Hz with corresponding r = 5.24 ± 0.13 Å, f = 0.32 ± 0.02, and χ2min = 3.8.

