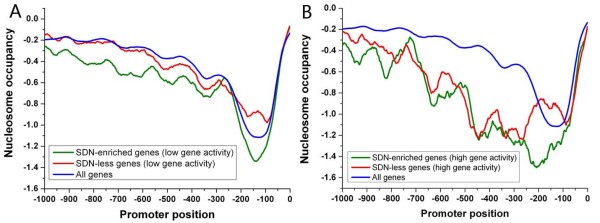
Figure 6.
Average nucleosome profiles are shown for subsets of SDN-enriched promoters (green), subsets of SDN-less promoters (red) and all promoters (blue). (A) Average nucleosome profiles [7] are shown for promoters whose downstream genes have low transcription rates [20] (normalized values less than 0) in both classes and all promoters. (B) Average nucleosome profiles are shown for promoters whose downstream genes have high transcription rates (normalized values greater than 0.5) in both classes and all promoters.

