Figure 3.
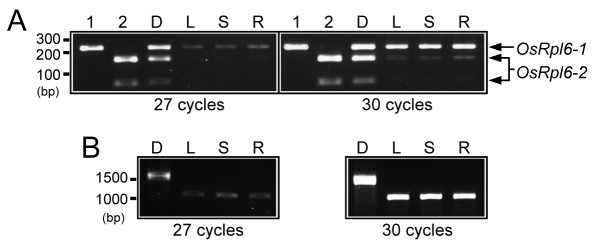
Semi-quantitative RT-PCR analysis of the rice rpl6 genes. (A) Comparison of the relative amounts of OsRpl6-1 and OsRpl6-2 cDNAs after 27 (left panel) or 30 cycles of PCR (right panel). Bands derived from each gene are indicated by arrows. Lanes 1 and 2: negative and positive controls for DraI digestion using cloned OsRpl6-1 and OsRpl6-2 plasmid DNAs as templates, respectively. Note that the OsRpl6-2 gene has a DraI site in its coding region (Fig. 1A), resulting in two bands after digestion, whereas the OsRpl6-1 gene does not. Lane D: DraI digestion of OsRpl6-1 and OsRpl6-2 DNA products, which were amplified using rice genomic DNA as a template instead of first-strand cDNAs. Lanes L, S and R: from left to right, relative amounts of OsRpl6-1 and OsRpl6-2 cDNAs in mature leaf, leaf sheath and root. (B) Amplification of rice Actin genes as an internal control. Molecular size standards are shown on the left.

