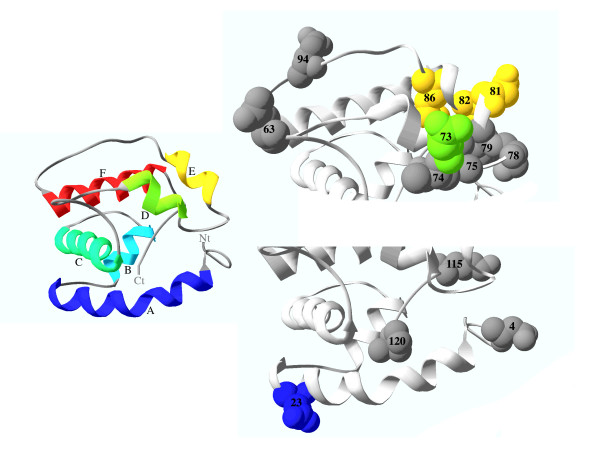
Figure 8.
Location of the amino acid positions identified in the ML analyses on the predicted 3D structure. Helices, and highlighted amino acids, are depicting with a colour ramp ranging from blue (N-terminal helix) to red (C-terminal helix). The amino acid positions are numbered according to the MSA in Figure 2. Ct, C-terminal end. Nt, N-terminal end.

