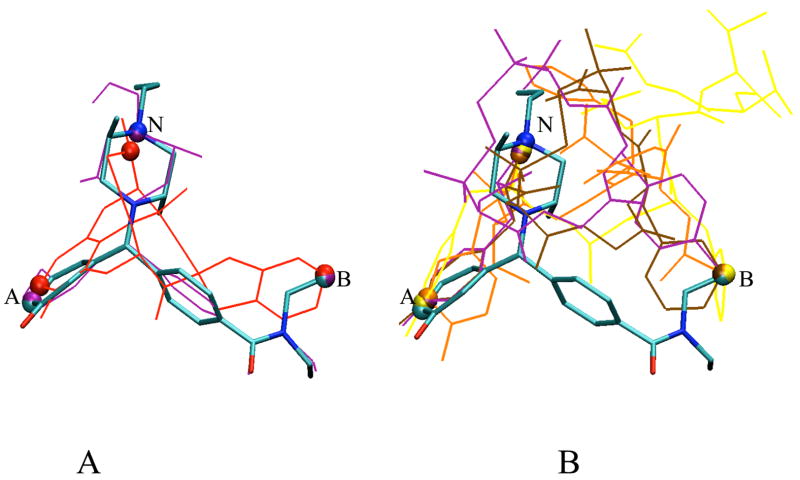
Figure 5.
Superimposition of conformations for A) non-peptidic ligands and B) peptidic ligands identified based on the δ opioid efficacy model. The reference compound 1 is colored based on atom type in bond format. The three atoms defining the pharmacophore points (A, B & N using MaxD criterion) are shown as spheres. Remaining structures as wireframe in the following colors: A) 6 in red and 7 in purple. B) 14 in yellow, 15 in brown, 16 in purple and 17 in orange.

