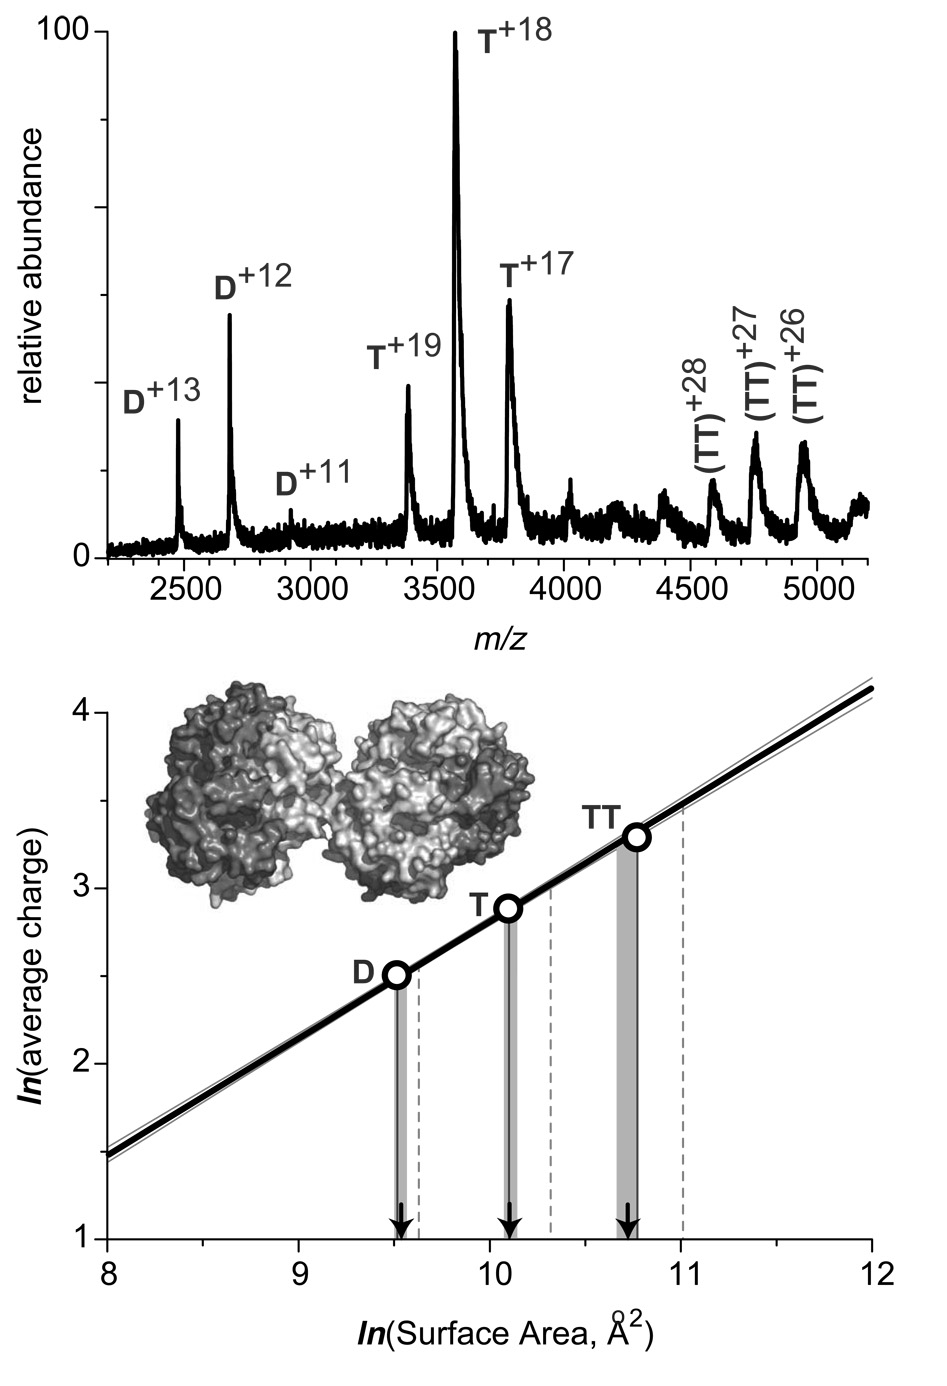
Figure 7.
ESI mass spectrum of human sickle cell hemoglobin (40 µM solution, calculation of molar concentration is based on the tetrameric structure) acquired at neutral pH in 10 mM ammonium acetate. The diagram at the bottom illustrates evaluation of surface areas of dimers (D), tetramers (T), and octamers (TT) based on the experimentally measured average number of charges accommodated by the respective protein ions and the previously determined charge-surface correlation. The calibration line in this diagram is the least squares fit for the experimental data presented in Figure 2 (none of the sickle cell hemoglobin species was used to construct the calibration curve). Vertical lines projected from the x-axis represent the numerical values of surfaces of the protein species based upon crystal structures of oligomers (solid) and simple summation of the surfaces of the constituent monomeric species (dashed). Arrows indicate the numerical value of surfaces estimated based on the ESI MS data, with shaded areas representing confidence intervals for such estimates.

