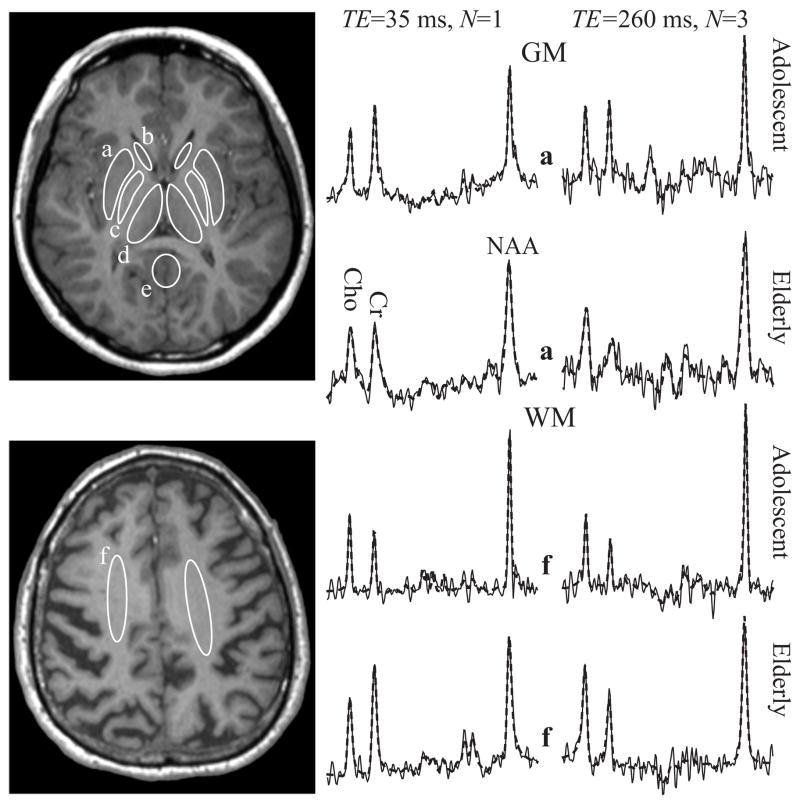
Fig. 3.
Left, top: Axial T1-weighted image at the basal ganglia level from an adolescent showing the manually outlined GM structure ROIs in the putamen (a), caudate (b), globus pallidus (c), thalamus (d) and posterior cingulate gyrus (e).
Left, bottom: Axial image of an elderly subject with ROIs in the centrum semiovale (f).
Right: GM and WM spectra from the ROIs (a) and (f) at both TEs (solid lines), superimposed with their model functions (dashed lines) fit (3) for NAA, Cr and Cho. Each pair of short and long TE spectra is (i) from the same subject; and (ii) the same voxel within the indicated structure. Note the excellent SNR and fit in all regions and at both TEs.

