
Figure 1. Graph of in-hospital mortality rates for individual hospitals by annual hospital esophageal resection volume.
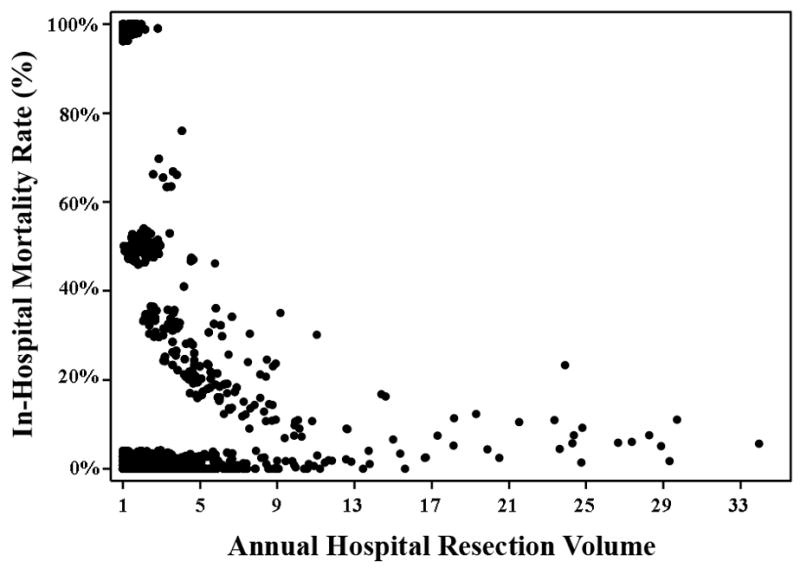
These data represent the annual hospital mortality rates of in-hospital death at 1,506 different hospitals. The data points have been staggered to illustrate the trend, due to the high frequency of overlapping values.