
Figure 2. Graph showing the different mortality rates above and below each volume threshold.
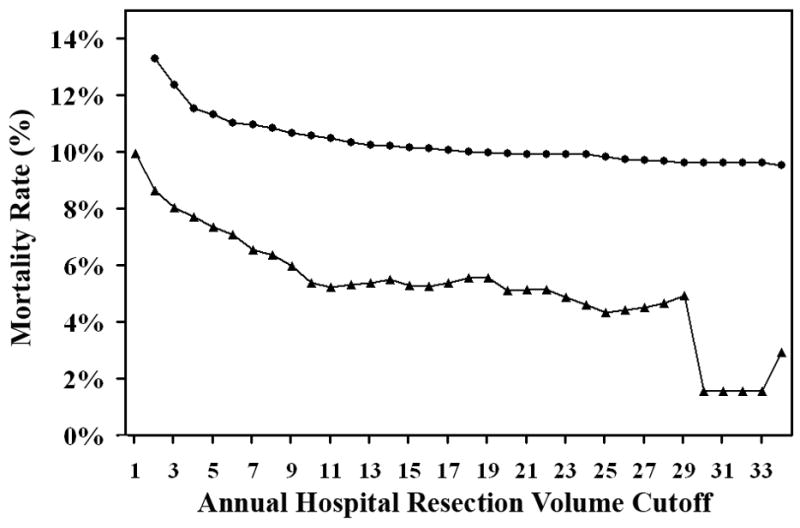
Squares indicate the mortality rates of hospitals with annual esophagectomy volumes for esophageal cancer less than the volume threshold. Triangles indicate the mortality rates of hospitals with annual esophagectomy volumes for esophageal cancer greater or equal to the volume threshold. The difference between each pair of mortality rates at a given annual hospital volume is statistically significant for all volume thresholds except ≥29 and ≥34. Associated data are listed in Table 2.