
Figure 3. Graph of goodness-of-fit versus annual hospital resection volume.
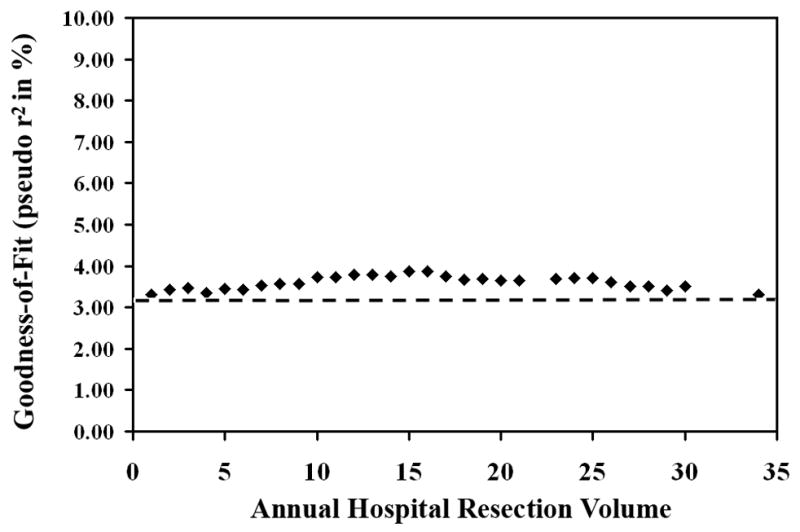
Each point represents one resection volume. McFadden’s pseudo r2 is shown as percent. Dashed line represents “baseline” McFadden’s pseudo r2 from the model without resection volume (3.23%).