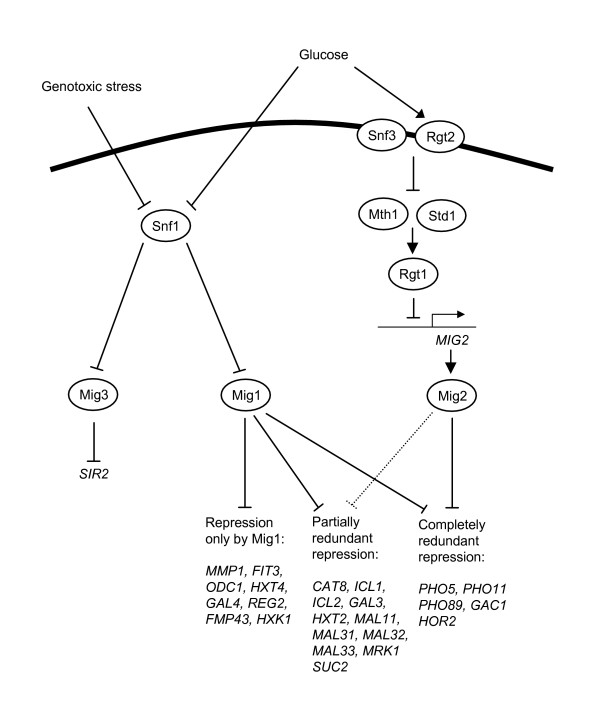
Figure 1.
Overview of the glucose repression and glucose induction pathways in the yeast S. cerevisiae. For each regulatory step, positive control is shown as an arrow, and negative control as a crossbar. Examples of differentially regulated genes that are discussed in the present study are shown at the bottom.

