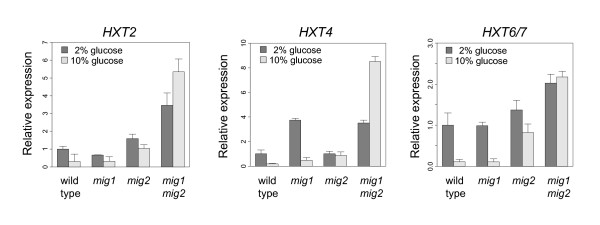
Figure 5.
Real-time PCR quantifications of HXT gene expression. Real-time PCR quantifications of HXT mRNA in wild type, mig1, mig2, and mig1 mig2 cells grown on both 2% and 10% glucose. All values were normalized relative to the expression in the wild type strain on 2% glucose. The plot shows mean values of three biological replicates, with standard deviations indicated by the error bars.

