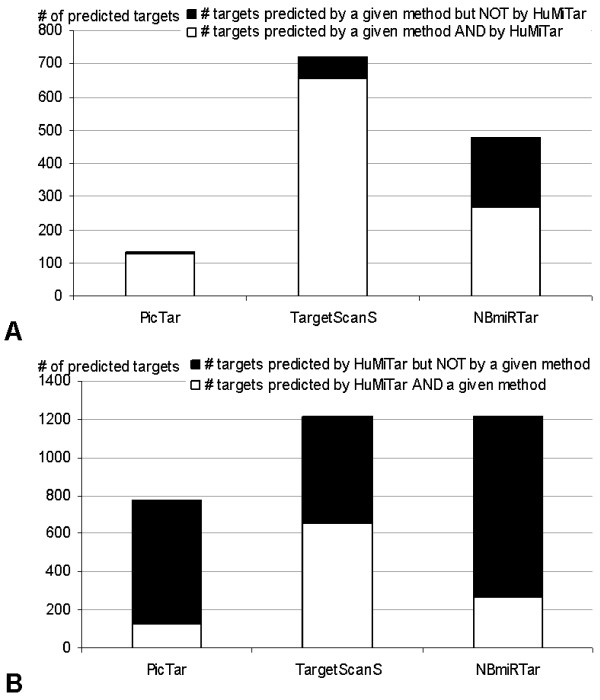
Figure 2.
Comparison of the number of predicted targets and their overlap for predictions on the GO set. Panel A shows the number of targets predicted by the three competing methods including PicTar, TargetScanS, and NBmiRTar. The white area represents targets that overlap with predictions of HuMiTar and the black area shows the remaining targets. Panel B shows the number of targets predicted by HuMiTar. The white area shows overlap with predictions of a competing method indicated at the x-axis, and the black area shows predictions specific to HuMiTar. In the case of PicTar, the predictions are reduced to a set of miRs that are included in the PicTar's database http://pictar.mdc-berlin.de/.

