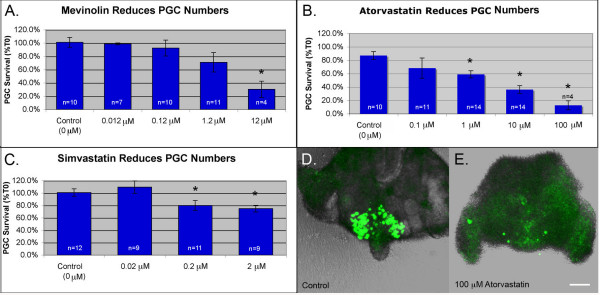
Figure 3.
Statin treatment reduces PGC survival. PGCs were counted in tissue cultured in (A) mevinolin (B) atorvastatin or (C) simvastatin. Average percent survival ± s.e.m. is shown. n = number of slices. "* " = groups that differed from controls. (F < 0.05 Analysis of Variance from Walpole and Meyer with Fishers least significance post test). (D) A control slice after culture. (E) A slice treated with 100 μM atorvastatin. Note sloughing of somatic cells from the surface of the slice. Scale bar is 100 μm.

