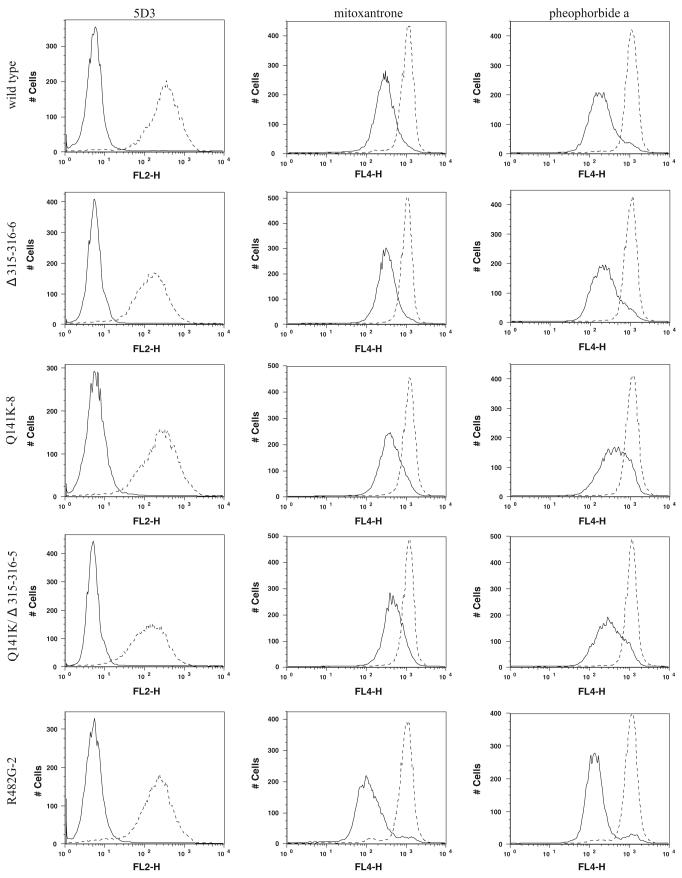
Fig. 3.
Mitoxantrone and pheophorbide a efflux. First column:▶ ABCG2 surface expression with the 5D3 antibody for one representative clone of each mutant (as described in Fig. 1). Second and third columns: mitoxantrone and pheophorbide a efflux for the same mutants, respectively. For the efflux experiments, stably transfected cells were trypsinized and incubated for 30 min in complete media containing 20 μM mitoxantrone or 1 μM pheophorbide a with or without 10 μM of the ABCG2-blocker FTC. Efflux is represented by the shift between the histograms with (dashed line) and without (solid line) FTC

