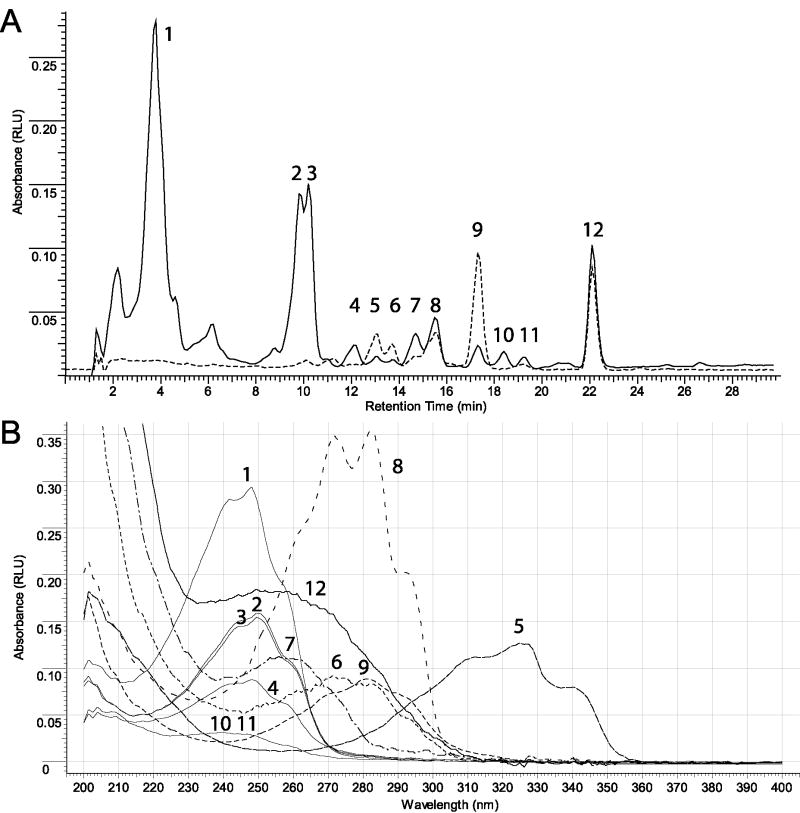
Figure 1. UVB- driven photolysis of 4S (as an example).
(A) RP-HPLC separation of 4S irradiation products after treatment with UVB for 15 minutes. (B) Representative UV spectra of irradiated samples. Peak number (Panel A) corresponds to predicted structure based on UV spectra (Panel B). Peaks were assigned as follows: 1-4, 10, 11 – isoT-like and oxidized isoT-like; 5 – 5S; 6 – 4S-L; 7 – 4S-D; 8 – 4S; 9 – 4S-T; 12 – 4S-pD. The UV spectra for RP-HPLC (Panel A) were measured at 280 nm.
Representative UV spectra of irradiated samples of 4R (c) and 4S (d). (1 – 5c, 2-5cD, 3 – unknown product, 4 – 5cT, 5 – 5c1, 6 – unknown product).

