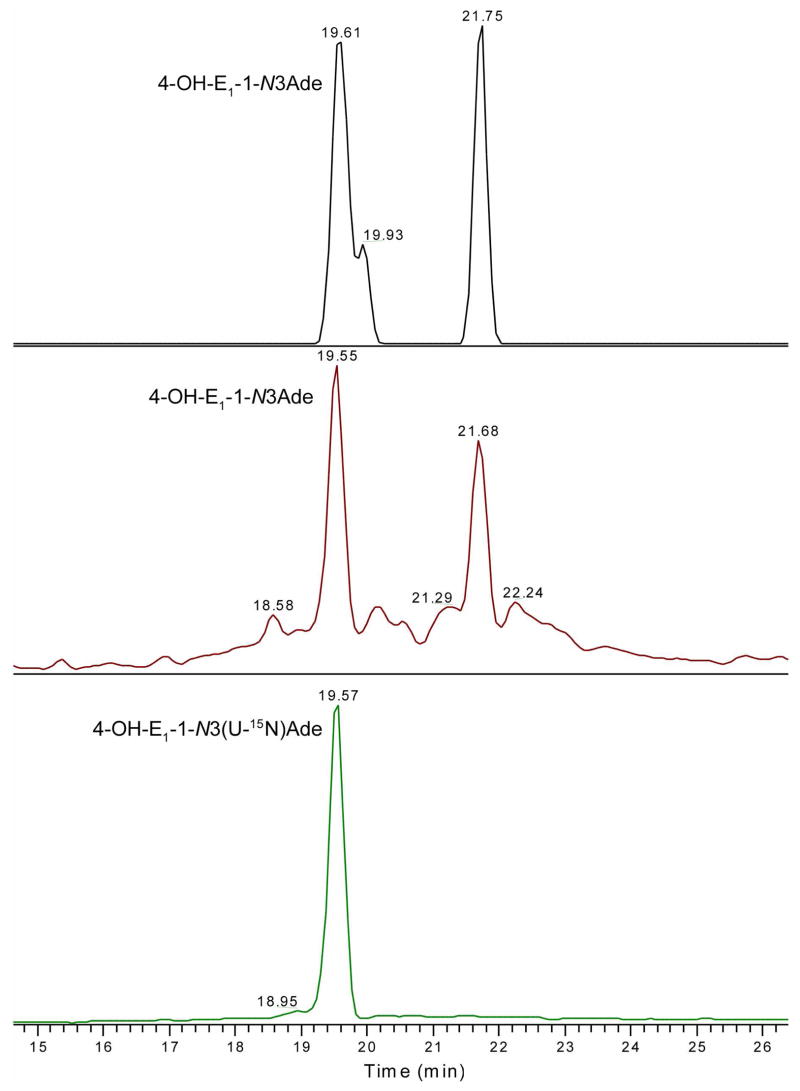
Figure 6.
Product mixture from reaction of CE1Q and calf thymus DNA at 37 °C, pH 7.4, as analyzed with the ion-trap/FT-ICR mass spectrometer. Accurate mass measurement in top panel shows two and possibly three major CE1-Ade adducts. The middle panel show the corresponding TIC measured in ion trap. Bottom panel shows the TIC of internal standard, 4-OH-E1-1-N3 (U-15N)Ade in ion trap.

