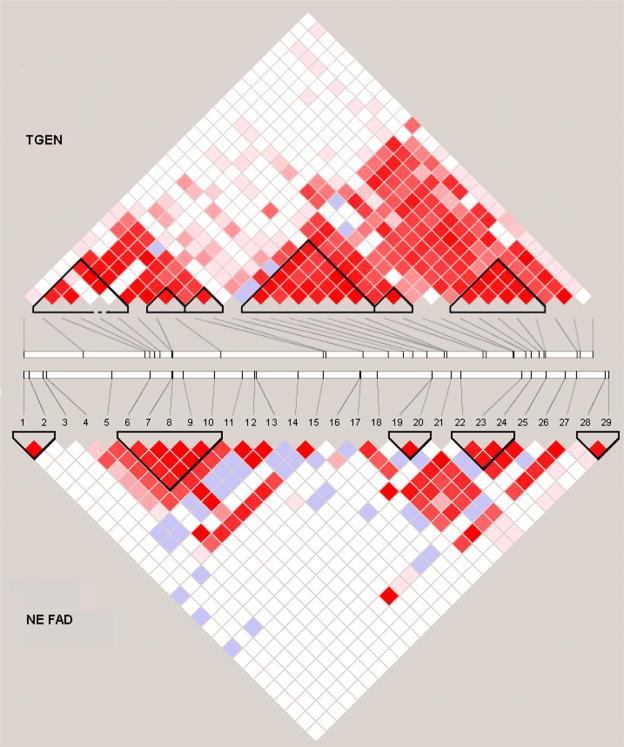
Figure 1.
Linkage disequilibrium (LD) structure of SORL1. Relative locations of SNPs included in each dataset are shown on two parallel stick diagrams, with LD maps for the TGEN dataset located above and the north European familial AD dataset studied by Rogaeva et al. [1] below the gene structure. The measure of LD (D′) among all possible pairs of SNPs is shown graphically according to the shade of red where white represents very low D′ and dark red represents very high D′. High D′ estimates associated with a large confidence interval (most likely due to one of the alleles being rare) are denoted by blue squares.

