Abstract
Bile acids are steroid detergents that are toxic to mammalian cells at high concentrations; increased exposure to these steroids is pertinent in the pathogenesis of cholestatic disease and colon cancer. Understanding the mechanisms of bile acid toxicity and apoptosis, which could include nonspecific detergent effects and/or specific receptor activation, has potential therapeutic significance. In this report we investigate the ability of synthetic enantiomers of lithocholic acid (ent-LCA), chenodeoxycholic acid (ent-CDCA), and deoxycholic acid (ent-DCA) to induce toxicity and apoptosis in HT-29 and HCT-116 cells. Natural bile acids were found to induce more apoptotic nuclear morphology, cause increased cellular detachment, and lead to greater capase-3 and -9 cleavage compared with enantiomeric bile acids in both cell lines. In contrast, natural and enantiomeric bile acids showed similar effects on cellular proliferation. These data show that bile acid-induced apoptosis in HT-29 and HCT-116 cells is enantiospecific, hence correlated with the absolute configuration of the bile steroid rather than its detergent properties. The mechanism of LCA- and ent-LCA-induced apoptosis was also investigated in HT-29 and HCT-116 cells. These bile acids differentially activate initiator caspases-2 and -8 and induce cleavage of full-length Bid. LCA and ent-LCA mediated apoptosis was inhibited by both pan-caspase and selective caspase-8 inhibitors, whereas a selective caspase-2 inhibitor provided no protection. LCA also induced increased CD95 localization to the plasma membrane and generated increased reactive oxygen species compared with ent-LCA. This suggests that LCA/ent-LCA induce apoptosis enantioselectively through CD95 activation, likely because of increased reactive oxygen species generation, with resulting procaspase-8 cleavage.
Bile acids are physiologic steroids that are necessary for the proper absorption of fats and fat-soluble vitamins. Their ability to aid in these processes is largely due to their amphipathic nature and thus their ability to act as detergents. Despite the beneficial effects, high concentrations of bile acids are toxic to cells (1-11). High fat western diets induce extensive recirculation of the bile acid pool, resulting in increased exposure of the colonic epithelial cells to these toxic steroids (12, 13). A high fat diet is also a risk factor for colon carcinogenesis; increased bile acid exposure is responsible for some of this risk. Bile acids can contribute to both colon cancer formation and progression, and their effects on colonic proliferation and apoptosis aid this process by disrupting the balance between cell growth and cell death, as well as helping to select for bile acid-resistant cells (14, 15).
In colonocyte-derived cell lines bile acid-induced apoptosis is thought to proceed through mitochondrial destabilization with resulting mitochondrial permeability transition formation and cytochrome c release as well as generation of oxidative stress (1, 9-11). Bile acid-induced apoptosis has also been extensively explored in hepatocyte derived cell lines with mechanisms including mitochondria dysfunction (16-23), endoplasmic reticulum stress (24), ligand-independent activation of death receptor pathways (18, 25-28), and modulation of cellular apoptotic and anti-apoptotic Bcl-2 family proteins (29).
Although ample evidence exists for multiple mechanisms of bile acid-induced apoptosis, the precise interactions responsible for initiating these apoptotic pathways are still unclear. Bile acids have been shown to interact directly with specific receptors (30, 31). These steroids can also initiate cellular signaling through nonspecific membrane perturbations (32), and evidence exists showing that other simple detergents (i.e. Triton X-100) are capable of inducing caspase cleavage nonspecifically with resultant apoptosis (33). Therefore, hydrophobic bile acids may interact nonspecifically with cell membranes to alter their physical properties, bind to receptors specific for these steroids, or utilize a combination of both specific and nonspecific interactions to induce apoptosis.
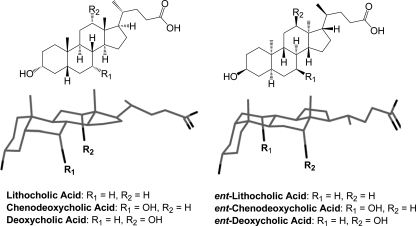
Bile acid enantiomers could be useful tools for elucidating mechanisms of bile acid toxicity and apoptosis. These enantiomers, known as ent-bile acids, are synthetic nonsuperimposable mirror images of natural bile acids with identical physical properties except for optical rotation. Because bile acids are only made in one absolute configuration naturally, ent-bile acids must be constructed using a total synthetic approach. Recently we reported the first synthesis of three enantiomeric bile acids: ent-lithocholic acid (ent-LCA),2 ent-chenodeoxycholic acid (ent-CDCA), and ent-deoxycholic acid (ent-DCA) (Fig. 1) (34, 35). Enantiomeric bile acids have unique farnesoid X receptor, vitamin D receptor, pregnane X receptor, and TGR5 receptor activation profiles compared with the corresponding natural bile acids (34). This illustrates that natural and enantiomeric bile acids interact differently within chiral environments because of their distinct three-dimensional configurations (Fig. 1). Despite these differences in chiral interactions, ent-bile acids have physical properties identical to those of their natural counterparts including solubility and critical micelle concentrations (34, 35). With different receptor interaction profiles and identical physical properties compared with natural bile acids, ent-bile acids are ideal compounds to differentiate between the receptor-mediated and the non-receptor-mediated functions of natural bile acids.
FIGURE 1.
Natural and enantiomeric bile acids. Structures and three-dimensional projection views of natural LCA, CDCA, DCA, and their enantiomers (ent-LCA, ent-CDCA, and ent-DCA). The three-dimensional ent-steroid structure is rotated 180° around the long axis for easier comparison with the natural steroid.
In this study we explore the enantioselectivity of LCA-, CDCA-, and DCA-mediated toxicity and apoptosis in two human colon adenocarcinoma cell lines, HT-29 and HCT-116. Because the mechanism of natural LCA induced apoptosis has never been characterized, we then examined in more detail LCA- and ent-LCA-mediated apoptosis in colon cancer cells. These studies will not only explore the LCA apoptotic mechanism but will also determine whether ent-LCA signals through similar cellular pathways.
EXPERIMENTAL PROCEDURES
Chemicals and Reagents—LCA was obtained from Sigma, CDCA was obtained from Acros Organics (Morris Planes, NJ), and DCA was obtained from Steraloids (Newport, RI). ent-LCA, ent-CDCA, and ent-DCA were synthesized as previously described (34, 35). Natural and enantiomeric bile acid stock solutions were prepared in EtOH at a concentration of 100 mm using a Thermo Electron Corporation Orion-Cahn C-33 microbalance (Waltham, MA) to precisely weigh the samples. Z-VAD-FMK (pan-caspase inhibitor), Z-VDVAD-FMK (caspase-2 inhibitor), and Z-IETD-FMK (caspase-8 inhibitor) were purchased from Calbiochem and prepared as 10 mm stocks in Me2SO. 5-(and-6)-Chloromethyl-2′,7′-dichlorodihydrofluorescein diacetate, acetyl ester (CM-H2DCFDA) was purchased from Invitrogen.
Cell Culture—HT-29 and HCT-116 human colon adenocarcinoma cells were purchased from the American Type Culture Collection (Manassas, VA). All of the cell lines were maintained in DMEM (Cellgro, Herndon, VA) supplemented with 10% heat-inactivated fetal bovine serum (Sigma), and 1% antibiotic-antimycotic solution (Cellgro) at 37 °C in a humidified 5% CO2 atmosphere.
Cell Staining and Counting—HT-29 and HCT-116 cells were grown on sterile coverslips in 12-well plates (attached cell experiments) or in 12-well plates with no coverslips (detached cell experiments) until they reached ∼80% confluency. Fresh DMEM (0.75 ml) was added with bile acid or vehicle (EtOH). For staining of attached cells, the medium was removed after 1 h, and the cells were washed with PBS. The cells were then fixed with 10% formalin and stained with hematoxylin and eosin before mounting or permeabilized with cold methanol and then mounted with Vectashield mounting media with DAPI (Vector Laboratories Inc., Burlingame, CA) for nucleus visualization hematoxylin and eosin morphology was captured at 630×, whereas DAPI-stained nuclei were examined at 400× with a fluorescent microscope for characteristics of apoptosis including nuclear/chromatin condensation and/or fragmentation. The percentage of nuclei with apoptotic morphology were reported as a mean value ± S.D. with a sample size of n = 3.
To stain and count detached cells, the medium was removed after a treatment time of 1, 2, 4, or 8 h, and three small portions of detached cells were counted with a hemacytometer and averaged for one experiment (n = 1). A mean ± S.D. number of counted cells is reported (n = 3), which is proportional to the total number of detached cells at the indicated time point. At the 2 h time point, the remaining detached cells were fixed with 10% formalin, permeabilized with cold methanol, and mounted using Vectashield mounting media with DAPI (Vector Laboratories). The nuclei were then visualized at 400× with a fluorescent microscope.
Proliferation Assay (Hexosaminidase Assay)—The cells were plated in a 96-well plate at a density of 104 cells/well. The cells were allowed to attach overnight, resulting in nearly 30% confluency, after which they were treated with 200 μl of medium containing bile acids or vehicle (EtOH). After the desired treatment time, the medium was removed, and the cells in each well were washed with 200 μl of PBS. The hexosaminidase assay was then performed as described previously (36). Cell proliferation was normalized to vehicle (EtOH)-treated control cells, and all of the means were calculated from a sample size of n ≥ 3.
Protein Detection by Western Blotting—HT-29 and HCT-116 cells were plated in 6-well plates and treated with bile acid or vehicle (EtOH) at about 80% confluency. Attached and detached cells were collected and combined, and then the cell lysates were subjected to polyacrylamide gel electrophoresis (Bio-Rad). Protein was transferred to Immobilon-P transfer membrane (Millipore, Billerica, MA). Antibodies for caspase-3 (catalog number 9662), caspase-9 (catalog number 9502), caspase-2 (catalog number 2224), caspase-8 (catalog number 9746), and Bid (catalog number 2002) were purchased from Cell Signaling Technology (Beverly, MA). The antibody for actin (catalog number 1616) was purchased from Santa Cruz Biotechnology (Santa Cruz, CA). Anti-rabbit and anti-mouse secondary antibodies were purchased from GE Healthcare, whereas anti-goat secondary antibody was purchased from Santa Cruz Biotechnology. The proteins were visualized by detection with Amersham ECL Western blot detection reagents (GE Healthcare).
Treatment with Caspase Inhibitors—HT-29 and HCT-116 cells were plated in 6-well plates and treated with 1 ml of medium with inhibitor or vehicle (EtOH) at about 80% confluency. Z-VAD-FMK (pan-caspase inhibitor), Z-VDVAD-FMK (caspase-2 inhibitor), and Z-IETD-FMK (caspase-8 inhibitor) were all applied at a concentration of 50 μm. After the pretreatment time, 1 ml of 1 mm LCA or ent-LCA was added without removing the existing media to produce a bile acid concentration of 500 μm in the resulting solution. The samples were then processed for Western blotting or cell staining after the indicated treatment time.
CD95 Immunofluorescence—HT-29 and HCT-116 cells were grown on sterile coverslips in 12-well plates until they reached ∼80% confluency. Fresh DMEM (0.75 ml) was added with bile acid or vehicle (EtOH). The medium was removed after 30 min, and the cells were washed with PBS and then fixed for 30 min with 4% formalin/PBS. When permeabilization was required, the cells were treated with 0.5% Triton X-100/PBS for 10 min. The cells were washed with 2× PBS and then blocked for 1 h with 3% bovine serum albumin/PBS. After washing with 2× PBS, the cells were incubated with 1:100 rabbit anti-CD95 antibody (sc-714; Santa Cruz Biotechnology) in PBS overnight at 4 °C, washed with 3× PBS and then incubated at room temperature with 1:2000 AlexaFluor-488 conjugated goat anti-rabbit antibody (A11008; Invitrogen) in PBS for 1 h. After washing with 3× PBS, the coverslips were mounted with Vectashield mounting media with DAPI (Vector Laboratories) and then examined at 400× with a fluorescent microscope. The percentage of cells with the majority of Fas distributed along the cell membrane were determined and reported as a mean value ± S.D. after counting a minimum of 100 cells from three fields with n = 3.
ROS Generation—HT-29 and HCT-116 cells plated in 6-well plates were treated with 5 μm of CM-H2DCFDA in PBS at 37 °C for 30 min. The solution was then removed and replaced with DMEM with or without bile acids. After the indicated time point (5, 10, or 30 min) the medium was removed, and the cells were washed with cold PBS and then pelleted and lysed with 0.05% Triton X-100/water followed by sonication. The resulting suspension was centrifuged, and the fluorescence of the remaining supernatant was measured with excitation at 485 nm and emission at 528 nm. All of the fluorescence values were normalized to control values and were reported as a mean fold increase in fluorescence relative to control cells ± S.D. with n = 3.
Data Analysis—All of the values are reported as the means ± S.D. or the means ± S.E. The p values were calculated using an unpaired two-tailed t test, and statistical significance was taken as p < 0.05.
RESULTS
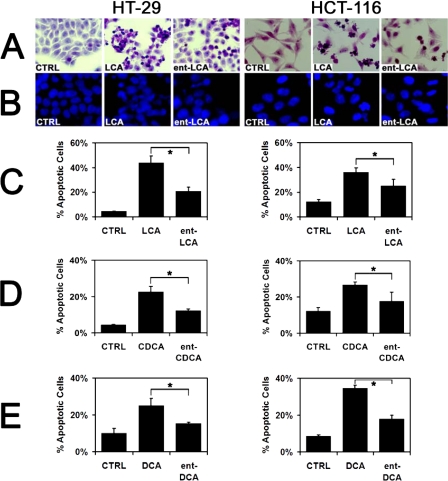
Natural Bile Acids Induce More Apoptosis than ent-Bile Acids—In both HT-29 and HCT-116 cells, 500 μm LCA and ent-LCA induced marked morphologic signs of apoptosis that were not seen in control cells (Fig. 2A). These included cellular shrinkage, nuclear condensation, and cytoplasmic blebbing. Natural LCA induced morphologic signs of apoptosis in more cells than ent-LCA. Similar patterns were observed with CDCA and DCA, resulting in more cells with morphologic signs of apoptosis compared with ent-CDCA and ent-DCA respectively (data not shown).
FIGURE 2.
Apoptotic morphology of HT-29 and HCT-116 cells in response to natural and enantiomeric bile acids. A, hematoxylin- and eosin-stained HT-29 and HCT-116 cells treated with 500 μm LCA or ent-LCA, or vehicle control (CTRL, EtOH) for 1 h. B, HT-29 and HCT-116 cells treated with 500 μm LCA or ent-LCA, or vehicle control for 1 h followed by staining of the cell nuclei with DAPI. C-E, percentage of DAPI stained HT-29 and HCT-116 cells that exhibited apoptotic nuclear morphology (condensed nucleus/chromatin, irregular or fragmented nucleus) after a 1-h treatment with 500 μm LCA and ent-LCA (C), 500 μm CDCA and ent-CDCA (D), or 500 μm DCA and ent-DCA (E). The values are reported as the means ± S.D. (n = 3). *, p < 0.05.
DAPI staining was utilized to examine apoptotic changes in nuclear morphology including condensation and fragmentation. Similar to apoptotic changes in cellular morphology, LCA-treated cells had more DAPI-stained nuclei with characteristics of apoptosis than ent-LCA-treated cells (Fig. 2B). Quantitation of the apoptotic nuclei confirmed that LCA treatment led to a significantly increased percentage of apoptotic nuclei compared with ent-LCA treatment in both cell lines (Fig. 2C). CDCA/ent-CDCA and DCA/ent-DCA treatment resulted in increased apoptotic nuclear morphology as well (data not shown). CDCA and DCA also led to a significantly greater percentage of apoptotic nuclei compared with ent-CDCA and ent-DCA in HCT-116 and HT-29 cells (Fig. 2, D and E).
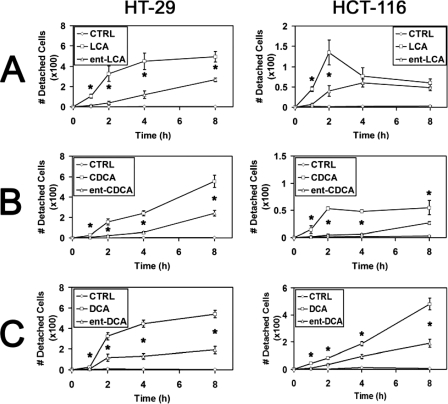
Having demonstrated that natural bile acids rapidly induce more morphologic signs of apoptosis compared with enantiomeric bile acids, we next sought to investigate cellular detachment in response to these compounds. Treatment of HT-29 and HCT-116 cells with 500 μm LCA led to significantly increased cellular detachment compared with treatment with ent-LCA at most time points tested (Fig. 3A). In HCT-116 cells the number of detached cells appeared to decrease at longer time points; however, this most likely results from rapid cellular degradation into apoptotic bodies, which are difficult to visualize (Fig. 3A). CDCA (Fig. 3B) and DCA (Fig. 3C) similarly induced more cellular detachment in HT-29 and HCT-116 cells than ent-CDCA and ent-DCA, respectively. DAPI staining of the detached cells after treatment with all bile acids (data not shown) illustrated apoptotic nuclear morphology, indicating that the detached cells were in fact apoptotic, nonviable cells rather than live cells that simply lost their adhesion to the plate surface.
FIGURE 3.
Cellular detachment of HT-29 and HCT-116 cells in response to natural and enantiomeric bile acids. Relative number of detached cells after treatment for 1, 2, 4, or 8 h with vehicle control (CTRL, EtOH) and 500 μm LCA and ent-LCA (A), 500 μm CDCA and ent-CDCA (B), or 500 μm DCA and ent-DCA (C). For all of the experiments, the values are reported as the means ± S.D. (n = 3). *, p < 0.05.
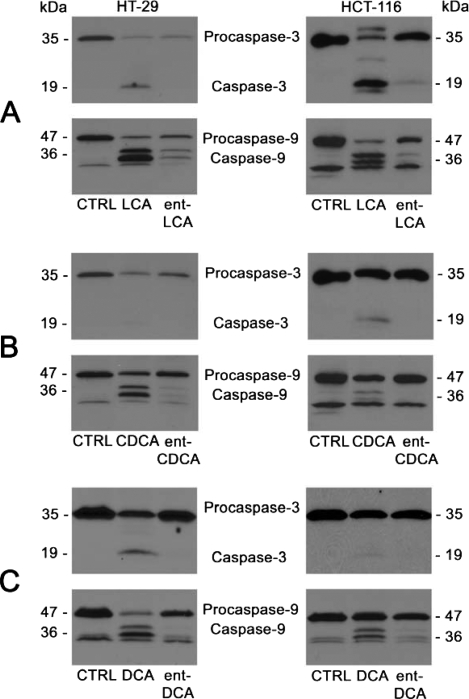
To further confirm that natural bile acids induce more apoptosis than their enantiomers, we examined caspase activation, which is the biochemical evidence of apoptosis. Inactive procaspase-3 and procaspase-9 and their active cleavage products caspase-3 and caspase-9 were detected. Caspase-3 is an executioner caspase important for carrying out apoptosis. Caspase-9 activates caspase-3 in type II apoptotic processes proceeding through the mitochondrial pathway, which is important because bile acid apoptosis is known to involve the mitochondria (1, 2, 9, 10, 20-22, 37). In HT-29 and HCT-116 cells, 500 μm LCA and ent-LCA induced caspase activation (Fig. 4A). However, ent-LCA led to decreased activation of procaspase-3 and -9 compared with its natural counterpart LCA. Natural bile acids CDCA (Fig. 4B) and DCA (Fig. 4C) also induced more caspase cleavage than ent-CDCA and ent-DCA, respectively (35). In all experiments the amount of activated caspase-3 was proportional to the amount of activated caspase-9, suggesting that caspase-3 activation may result primarily from activation by caspase-9 through a type II apoptotic pathway. These morphologic and caspase activation data also demonstrate that natural bile acids are more potent inducers of apoptosis than their enantiomeric counterparts.
FIGURE 4.
Caspase-3 and caspase-9 activation in HT-29 and HCT-116 cells following treatment with natural and enantiomeric bile acids. HT-29 and HCT-116 cells were treated for 1 h with vehicle control (CTRL, EtOH) and 500 μm LCA and ent-LCA (A), 500 μm CDCA and ent-CDCA (B), or 500 μm DCA and ent-DCA (C). In all of the experiments, the attached and detached cells were collected, and active and inactive caspase-3 and caspase-9 were probed.
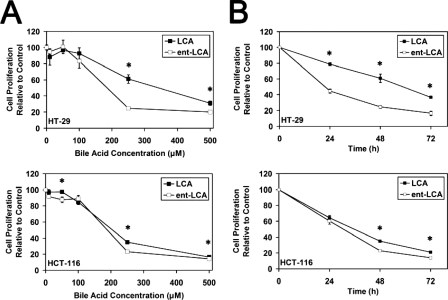
Natural and Enantiomeric Bile Acids Have Similar Effects on Cellular Proliferation—Knowing that natural bile acids are more potent inducers of apoptosis, we next sought to determine whether there were also significant differences in their effects on cellular proliferation. The changes in proliferation produced by both LCA and ent-LCA in HT-29 and HCT-116 cells were relatively similar, with low concentrations (10, 50, and 100 μm) producing minimal decreases in proliferation and with the high concentration of 500 μm producing a substantial decrease in proliferation (Fig. 5A). At 250 μm both compounds decreased proliferation relative to control; however, ent-LCA appeared to be slightly more toxic than LCA. When the toxicity at 250 μm was investigated at different time points, both compounds again showed similar decreases in proliferation, but ent-LCA was consistently more toxic (Fig. 5B).
FIGURE 5.
Proliferation of HT-29 and HCT-116 cells in response to natural and enantiomeric LCA. A, effects of varying concentrations (10, 50, 100, 250, and 500 μm) of LCA and ent-LCA on proliferation. All of the concentrations were applied for 48 h. B, time course analysis of HT-29 and HCT-116 proliferation in response to 250 μm LCA or ent-LCA at 24, 48, and 72 h. In all of the experiments, proliferation is determined by the hexosaminidase assay and is relative to vehicle-treated control (EtOH) (n ≥ 3). The values are expressed as the means ± S.E. *, p < 0.05.
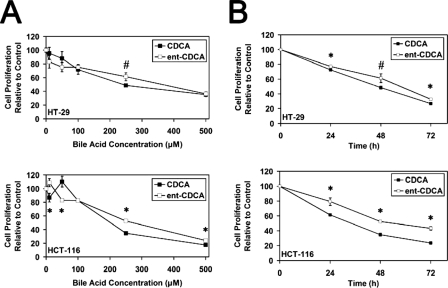
CDCA and ent-CDCA also appeared to have similar toxicity profiles. There was a consistent difference at 250 μm, where ent-CDCA demonstrated less toxicity than CDCA (Fig. 6A). When proliferation at 250 μm was examined over time, ent-CDCA showed smaller decreases in proliferation compared with CDCA (Fig. 6B). Previous work with DCA/ent-DCA in both HT-29 and HCT-116 cells also demonstrated that these compounds had similar cellular toxicity profiles (35).
FIGURE 6.
Proliferation of HT-29 and HCT-116 cells in response to natural and enantiomeric CDCA. A, effects of varying concentrations (10, 50, 100, 250, and 500 μm) of CDCA and ent-CDCA on proliferation. All of the concentrations were applied for 48 h. B, time course analysis of HT-29 and HCT-116 proliferation in response to 250 μm CDCA or ent-CDCA at 24, 48, and 72 h. In all of the experiments, proliferation is determined by the hexosaminidase assay and is relative to vehicle treated control (EtOH) (n ≥ 3). The values are expressed as the means ± S.E. *, p < 0.05; #, p < 0.06.
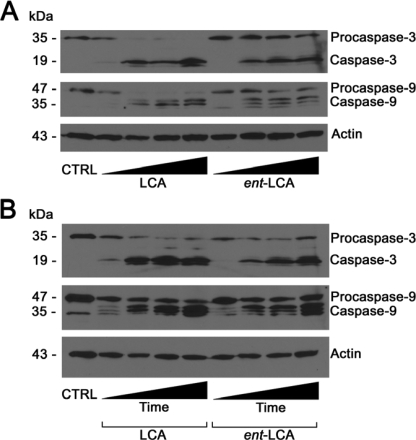
LCA Induces More Apoptosis than ent-LCA over Multiple Concentrations and Times—Because the pathway of LCA-induced apoptosis is unexplored in the literature, the mechanism of LCA and ent-LCA-induced apoptosis was investigated. In concentration-response experiments in HT-29 cells, LCA showed a greater proportion of activated caspase-3 and -9 at nearly every concentration, illustrating that this natural bile acid is a more efficient inducer of apoptosis than its enantiomer (Fig. 7A). These concentrations were chosen because below 250 μm other bile acids are not able to induce rapid apoptosis, whereas at concentrations greater than 600-700 μm, necrosis becomes the dominant pathway of cell death, which occurs in part by detergent-mediated dissolution of the cell membrane (1, 38). Similar concentration-response results were also obtained with LCA/ent-LCA in HCT-116 cells (supplemental Fig. S1).
FIGURE 7.
Dose and time dependence of LCA and ent-LCA induced caspase activation in HT-29 cells. A, increasing concentrations (250, 375, 500, and 625 μm) of LCA and ent-LCA were applied for 4 h to HT-29 cells. B, 500 μm LCA and ent-LCA were applied for increasing amounts of time (1, 2, 4, and 8 h) to HT-29 cells. In all of the experiments, attached and detached cells were collected, and active and inactive caspase-3 and caspase-9 proteins were detected. CTRL, control.
The amount of caspase cleavage in HT-29 cells was also found to increase as a function of time for both 500 μm LCA and ent-LCA, with more caspase cleavage in response to LCA at each time point (Fig. 7B). A time course analysis was also performed in HCT-116 cells and again showed increased LCA-induced apoptosis (supplemental Fig. S1).
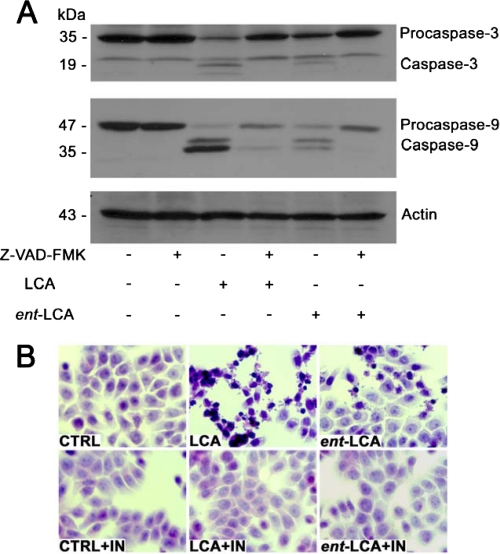
LCA and ent-LCA-induced Apoptosis Can Be Inhibited by a Pan-caspase Inhibitor—Knowing that LCA and ent-LCA treatment causes both biochemical and histological evidence of apoptosis in HT-29 and HCT-116 cells, we wanted to determine whether these effects were attributed primarily to apoptosis or to a combination of apoptosis and necrosis. Pretreatment of HT-29 cells with the pan-caspase inhibitor Z-VAD-FMK decreased formation of active caspase-3 and caspase-9 compared with treatment with LCA and ent-LCA alone (Fig. 8A) (39, 40). These data indicate that the pan-caspase inhibitor is capable of biochemically inhibiting natural and enantiomeric bile acid-induced apoptosis in HT-29 cells. Histological examination of HT-29 cells pretreated with the pan-caspase inhibitor showed a marked rescue of the apoptotic morphology seen with LCA and ent-LCA treatment alone (Fig. 8B). Identical results were obtained in HCT-116 cells, with Z-VAD-FMK pretreatment leading to biochemical and histological rescue after treatment with LCA or ent-LCA (supplemental Fig. S2).
FIGURE 8.
Inhibition of LCA- and ent-LCA-induced caspase activation in HT-29 cells by the pan-caspase inhibitor Z-VAD-FMK. A, treatment of Z-VAD-FMK and vehicle control (Me2SO) pretreated HT-29 cells with 500 μm LCA and ent-LCA for 1 h followed by detection of active and inactive caspase-3 and caspase-9. B, hematoxylin and eosin morphology of HT-29 cells after pretreatment with Z-VAD-FMK followed by 500 μm LCA or ent-LCA for 1 h. In inhibitor-treated experiments, the cells were pretreated with 50 μm Z-VAD-FMK for 6 h prior to bile acid treatment. IN, Z-VAD-FMK. CTRL, control.
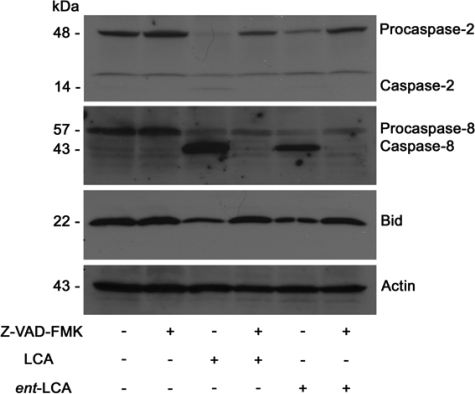
Caspase-8 and -2 Are Activated in LCA and ent-LCA-mediated Apoptosis—Because the primary mechanism of LCA/ent-LCA apoptosis at 1 h appears to be apoptosis, we wanted to explore the specific mechanisms of apoptosis initiation. Hydrophobic bile acids such as DCA and CDCA activate the CD95 death receptor (28, 41-43), ultimately leading to activation of the initiator caspase-8. Caspase-2 has been shown to be an initiator caspase that can promote mitochondrially mediated apoptosis, whereas Bid is cleaved to truncated Bid (tBid) by active caspase-8 and connects the external to the internal apoptotic pathway by promoting mitochondrial cytochrome c release (44, 45).
In HT-29 cells, caspase-2, caspase-8, as well as Bid are activated by treatment with 500 μm LCA and ent-LCA (Fig. 9). There are decreases in procaspase-2 and -8 that correspond to increases in caspase-2 and -8, and Bid levels are decreased in response to LCA and ent-LCA. Similar to previous experiments, the activation is more significant with LCA compared with ent-LCA (Fig. 9). Activation of caspase-2, caspase-8, and Bid were also analyzed in HCT-116 cells and produced similar results (supplemental Fig. S3).
FIGURE 9.
Initiator caspase activation by LCA and ent-LCA in HT-29 cells and inhibition by Z-VAD-FMK. Treatment of Z-VAD-FMK and vehicle control (Me2SO) pretreated HT-29 cells with 500 μm LCA or ent-LCA for 1 h followed by detection of active and inactive caspase-2 and caspase-8, as well as full-length Bid. Inhibitor-treated cells were pretreated with 50 μm Z-VAD-FMK for 6 h prior to bile acid treatment.
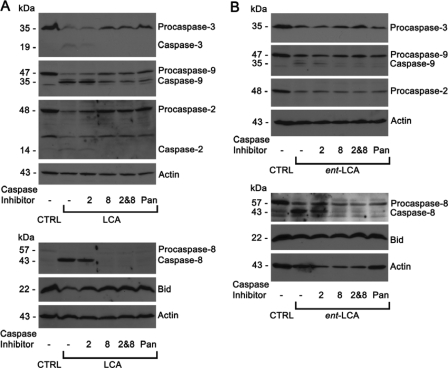
Apoptosis Mediated by LCA and ent-LCA Is Caspase-8-dependent—With LCA and ent-LCA activating caspase-2 and caspase-8, selective inhibitors of caspase-2 (Z-VDVAD-FMK) (46, 47) and caspase-8 (Z-IETD-FMK) (48) were used to elucidate the importance of each initiator caspase. In HT-29 cells LCA induced procaspase-3, -9, -2, and -8 cleavage to active caspases and a decrease in full-length Bid (Fig. 10A). The caspase-2 inhibitor was not effective in preventing LCA-induced apoptosis. Caspase-2 cleavage was noted with the caspase-2 inhibitor, implying that although the inhibitor blocks caspase-2 action, it will not block caspase-2 activation if activation occurs by another enzyme. The caspase-8 inhibitor dramatically inhibited cleavage of all caspases and Bid, indicating apoptosis inhibition (Fig. 10A). A combination of caspase-2 and caspase-8 inhibitors and the pan-caspase inhibitor Z-VAD-FMK also produced similar inhibition of caspase cleavage (Fig. 10A).
FIGURE 10.
Effects of selective caspase inhibition on LCA- and ent-LCA-induced caspase activation in HT-29 cells. Selective inhibitors of caspase-2 and caspase-8, a pan-caspase inhibitor, or vehicle control (CTRL, Me2SO) were used as pretreatment for HT-29 cells treated with 500 μm LCA for 1 h (A) and HT-29 cells treated with 500 μm ent-LCA for 1 h (B). In all of the experiments caspase inhibitor treated cells were pretreated with 50 μm Z-VDVAD-FMK (2 indicates caspase-2 inhibitor), Z-IETD-FMK (8 indicates caspase-8 inhibitor), or Z-VAD-FMK (Pan indicates pan-caspase inhibitor) for 4 h prior to bile acid exposure.
Caspase-8, caspase-2 and -8, and pan-caspase inhibitor-treated cells show a slight decrease in levels of procaspase-8 with no detectable active caspase-8 (Fig. 10A). This could indicate that a small amount of caspase-8 is activated with a self-catalytic mechanism being necessary for complete activation, which can be inhibited by the caspase-8 and pancaspase inhibitors (44).
Similar results were obtained with ent-LCA-induced apoptosis in HT-29 cells. The caspase-2 inhibitor did not prevent caspase cleavage, whereas the caspase-8 inhibitor, the combination of caspase-2 and caspase-8 inhibitors, and the pancaspase inhibitor Z-VAD-FMK decreased the amount of activated caspases (Fig. 10B). This can be appreciated most clearly by examining the decreased levels of active caspase-9 and caspase-8. The selective caspase-8 inhibitor produced similar results in HCT-116 cells treated with LCA and ent-LCA (supplemental Fig. S4).
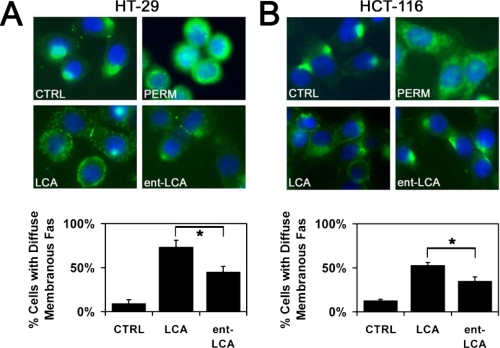
LCA and ent-LCA Induce CD95 Localization on the Cell Membrane—In hepatocytes, bile acid-mediated caspase-8 activation proceeds through CD95 oligomerization and translocation to the cell membrane (43, 49). To demonstrate that HT-29 cells and HCT-116 cells involve a similar pathway for activation of caspase-8, immunolocalization of CD95 was performed utilizing an N-terminal (extracellular) anti-CD95 antibody. In untreated/unpermeabilized HT-29 cells, the majority of CD95 was localized to a single cluster with only minimal amounts of the death receptor being diffusely distributed around the plasma membrane (Fig. 11A). Permeabilization of untreated HT-29 cells revealed significant intracellular stores of CD95 (Fig. 11A). The addition of 500 μm LCA resulted in diffuse membranous distribution of CD95 in a punctate pattern. This pattern was consistent with the CD95 translocation and aggregation seen in prior studies examining bile acid-induced apoptosis in hepatocytes (26, 43, 49). Similar results were noted with ent-LCA; however, the amount of CD95 distributed on the plasma membrane was markedly decreased compared with LCA-treated cells. These fluorescence micrographs were analyzed by determining the percentage of cells with a majority of their CD95 distributed diffusely along the plasma membrane. LCA treatment led to significantly more cells with diffuse CD95 distribution compared with ent-LCA (Fig. 11A). Furthermore, compared with untreated control cells, both bile acids produced more cells with diffuse distribution of CD95 around the cell membrane.
FIGURE 11.
Immunolocalization of CD95 in response to LCA and ent-LCA. HT-29 (A) and HCT-116 (B) cells were treated with 500 μm LCA or ent-LCA or control medium (CTRL) for 30 min and then probed for CD95. All of the cells were nonpermeabilized except for one set of control cells permeabilized with 0.5% Triton X-100 (PERM). Representative fluorescent micrographs are shown. The percentages of control and LCA- and ent-LCA-treated cells with the majority of CD95 diffusely distributed along the cell membrane are compared with untreated control cells. The values are reported as the means ± S.D. (n = 3). *, p < 0.05.
Similar results were obtained with immunolocalization experiments in HCT-116 cells where treatment with LCA caused more membranous distribution of CD95 compared with ent-LCA (Fig. 11B). These differences were found to be significant when the CD95 distribution patterns were quantitated, further illustrating the increased CD95 distribution on the cell membrane in response to LCA compared with ent-LCA (Fig. 11B).
LCA and ent-LCA Induce ROS Generation in Colon Adenocarcinoma Cell Lines—ROS generation was measured in HT-29 and HCT-116 cells with a technique applied previously to bile acids that utilizes the ROS sensor CM-H2DCFDA (17). In both HT-29 (Fig. 12A) and HCT-116 (Fig. 12B) cells, LCA and ent-LCA were able to induce immediate oxidative stress, even after only 5 min of treatment. The amount of ROS generation was similar at 5- and 10-min intervals after treatment with both LCA and ent-LCA. At 30 min LCA generated significantly more ROS than ent-LCA in HT-29 cells (Fig. 12A) and trended toward generation of more ROS in HCT-116 cells compared with ent-LCA (Fig. 12B).
FIGURE 12.
Reactive oxygen species generation in response to natural and enantiomeric LCA. HT-29 (A) and HCT-116 (B) cells pretreated with CM-H2DCFDA were exposed to 500 μm LCA or ent-LCA or control medium for either 5, 10, or 30 min. After the indicated time the amount of ROS was determined, and the values are reported as fold increases over untreated control cells. For all of the experiments the values are reported as the means ± S.D. (n = 3). *, p < 0.05; #, p < 0.07.
DISCUSSION
Bile steroid induced apoptosis is significant in the liver and colon where high concentrations of these molecules are found. Bile acids are unique among naturally occurring apoptotic agents because they have the potential to induce apoptosis through both nonspecific detergent effects and through receptor-mediated interactions. To determine the relative contributions of these two mechanisms to bile acid-induced apoptosis in the colon, we investigated the ability of both natural bile acids and their enantiomers to induce apoptosis in two human colon cancer cell lines: HT-29 and HCT-116.
Natural bile acids LCA, CDCA, and DCA initiated more apoptosis than their enantiomers ent-LCA, ent-CDCA, and ent-DCA in all morphological and biochemical assays of cellular apoptosis in HT-29 and HCT-116 cells. These data suggest that bile acid-induced apoptosis is mediated primarily through a specific molecular interaction, such as binding to a cellular receptor, that relies on the absolute configuration of these molecules rather than their nonspecific detergent properties. However, ent-bile acids were capable of inducing some apoptosis, although significantly less than the corresponding natural bile acids. Likely etiologies to explain this effect include a different pathway of apoptosis induction that is activated by the ent-bile acids or more likely decreased activation of an intracellular receptor by ent-bile acids compared with natural bile acids leading to decreased apoptosis.
These studies also revealed a trend of increasing apoptosis with increasing hydrophobicity for both the natural and enantiomeric bile acid series. The most hydrophobic bile acid LCA induced more apoptosis than the less hydrophobic CDCA and DCA. Likewise in the enantiomeric series, ent-LCA was a more potent inducer of programmed cell death than ent-CDCA and ent-DCA. Increased apoptosis from the hydrophobic bile acids may result from more rapid diffusion across the cell membrane or increased accumulation within hydrophobic regions of the cell, such as lipid bilayers. These results are also consistent with other literature reports demonstrating that bile acid hydrophobicity is proportional to cellular toxicity (3, 50, 51).
Because ent-bile acids are poorer inducers of apoptosis, we also wanted to determine whether these compounds showed decreased toxicity toward colon cancer cells. We examined the effects of LCA/ent-LCA and CDCA/ent-CDCA on cellular proliferation in HT-29 and HCT-116 cell lines. These bile acid pairs were found to have similar toxicity profiles with minimal effects on proliferation at concentrations of ≤100 μm and significant toxicity at 250 and 500 μm. Although ent-LCA and CDCA showed slightly more inhibition of proliferation at 250 μm than LCA and ent-CDCA, respectively, these differences were small in proportion to the absolute decreases in cellular proliferation observed. Prior work with DCA/ent-DCA showed similar results (35); therefore, no global trends were noted between the natural and enantiomeric bile acid groups as seen with apoptosis induction. Unlike apoptosis, natural and enantiomeric bile acid effects on cellular proliferation appear to be unrelated to the absolute configuration of the steroids, relying more on their general detergent properties.
The mechanism of LCA-induced apoptosis remains unexplored in the literature; therefore, we studied LCA-mediated apoptosis in HT-29 and HCT-116 cells. These colonocyte-derived cell lines are ideal for studying LCA, which is primarily present within the colon. Because of the poor reabsorption of this hydrophobic bile acid, LCA accounts for 29% of fecal bile acid content, whereas it accounts for only 1% of biliary bile acid content (52). LCA was a more rapid and potent inducer of apoptosis than ent-LCA in both HT-29 and HCT-116 cells. Both LCA- and ent-LCA-induced apoptosis proceeded through a mitochondrial/caspase-9-dependent pathway initiated by caspase-8. This pathway was not dependent on caspase-2 but could be inhibited through the use of a selective caspase-8 inhibitor. This suggests that LCA and ent-LCA induce apoptosis by the same caspase-8-dependent mechanism. Because LCA is a more potent inducer of apoptosis than ent-LCA, this also shows that caspase-8 activation is enantioselective, with LCA causing increased activation compared with ent-LCA.
One method of procaspase-8 cleavage to functional caspase-8 is through death receptor activation (38). Of the many members of the death receptor family, bile acids cause ligand-independent activation of CD95 in hepatocytes, resulting in subsequent procaspase-8 cleavage (9, 26-28, 41-43). There are also reports of caspase-8 activation in a death receptor-independent manner (53); however, no evidence exists showing bile acid activation of caspase-8 by other specific death receptor-independent mechanisms. Immunolocalization experiments indicate that in both HT-29 and HCT-116 cells, LCA and ent-LCA are able to induce increased cell membrane distribution of CD95. These results are similar to previous reports showing similar bile acid-mediated CD95 changes in hepatocytes (26, 43, 49). Consistent with the caspase-8 activation data, LCA causes increased CD95 membrane localization when compared with ent-LCA in both HT-29 and HCT-116 cells. These results suggest that initially both LCA and ent-LCA cause activation of CD95, which leads to initiator caspase-8 activation. Once activated, caspase-8 can then cleave Bid, resulting in the release of mitochondrial cytochrome c and subsequent activation of caspase-9. Active caspase-9 can then cleave procaspase-3 to active executioner caspase-3, which ultimately results in cellular apoptosis.
The mechanism of CD95 death receptor activation by dihydroxy bile acids (CDCA and DCA) has been studied in hepatocytes and is thought to proceed through the generation of oxidative stress by these steroids followed by epidermal growth factor receptor-dependent CD95 translocation and oligomerization (38). In the current studies LCA and ent-LCA were found to both generate a rapid ROS response in HT-29 and HCT-116 cells. Although both compounds induced a similar response within 5-10 min, LCA led to more ROS formation than ent-LCA at 30 min. These data show that similar to dihydroxy bile acids in hepatocytes, LCA and ent-LCA are capable of ROS generation in colon adenocarcinoma cells. Furthermore, the increased ability of LCA to generate ROS after 30 min of treatment parallels the increased CD95 membrane localization, increased caspase-8 activation, and increased apoptosis also seen with this natural bile acid compared with its enantiomer.
Bile acid oxidative stress, which ultimately leads to CD95 activation, can be generated through a multifactorial mechanism involving NADPH oxidase activation through a protein kinase C-dependent mechanism and interactions of bile acids with cellular mitochondria to directly generate ROS (54-56). More recent evidence has also implicated TGR5 activation as an important contributor to CD95 translocation and oligomerization (57). This is an intriguing association considering previous results showing that LCA and CDCA, but not ent-LCA nor ent-CDCA, are capable of TGR5 activation (34).
The current work demonstrates enantioselectivity in LCA/ent-LCA-induced apoptosis that exists throughout the apoptotic signaling cascade from CD95 membrane localization all the way to executioner caspase-3 activation. Enantioselectivity is also observed in potential CD95 activation mechanisms including ROS generation and TGR5 activation (34). Therefore, ent-LCA could serve as a valuable tool to further investigate the enantioselectivity in both ROS generation and TGR5 activation, as well as the importance of these enantioselective interactions in CD95/caspase-8-mediated LCA-induced apoptosis. Furthermore, demonstration of bile acid enantioselectivity is evidence of a direct interaction between the bile acid and specific cellular components, and this interaction could ultimately become a target for future therapeutic development. In a larger context, enantiomeric bile acid pairs could serve as useful tools for investigating the specific mechanisms of apoptosis induced by other bile acids as well, especially the dihydroxy bile acids CDCA and DCA.
Using steroid enantiomers, such as ent-bile acids, to differentiate between receptor- and non-receptor-mediated effects of natural steroids is a valuable technique for studying steroid biology. Other ent-steroids have been synthesized (58) and evaluated as probes of natural steroid interactions including ent-cholesterol (59, 60), ent-progesterone (61), ent-estrogen (62), and enantiomeric neuroactive steroids (63, 64). These reports illustrate that natural and enantiomeric steroids have distinctly different interactions with chiral environments, such as receptor-binding pockets. However, biophysical studies with model membrane lipids and the enantiomers of cholesterol and neuroactive steroids have failed to detect differences between natural and enantiomeric steroid interactions with lipids, indicating identical nonspecific interactions (60, 65, 66).
Taken together, these data demonstrate that ent-steroids are a reliable and well documented method for the study of natural steroid interactions. One question that arises in bile acid biology is whether the bile acid effect of interest results from a direct receptor interaction or general detergent properties of these steroids. ent-Bile acids are powerful tools that are able to distinguish between receptor- and non-receptor-mediated effects of natural bile acids and will be valuable for the continual exploration of bile acid biology.
Supplementary Material
This work was supported, in whole or in part, by National Institutes of Health Grants GM47969 (to D. F. C.), 5-T32-HL07275 (to B. W. K.), CA109269 (to S. A.), and DK33165 (to W. F. S.). The costs of publication of this article were defrayed in part by the payment of page charges. This article must therefore be hereby marked “advertisement” in accordance with 18 U.S.C. Section 1734 solely to indicate this fact.
The on-line version of this article (available at http://www.jbc.org) contains supplemental Figs. S1 and S2.
Footnotes
The abbreviations used are: LCA, lithocholic acid; CDCA, chenodeoxycholic acid; DCA, deoxycholic acid; ROS, reactive oxygen species; Z, benzyloxycarbonyl; FMK, fluoromethyl ketone; CM-H2DCFDA, 5-(and-6)-chloromethyl-2′,7′-dichlorodihydrofluorescein diacetate, acetyl ester; DMEM, Dulbecco's modified Eagle's medium; PBS, phosphate-buffered saline; DAPI, 4′,6′-diamino-2-phenylindole.
References
- 1.Yui, S., Saeki, T., Kanamoto, R., and Iwami, K. (2005) J. Biochem. (Tokyo) 138, 151-157 [DOI] [PubMed] [Google Scholar]
- 2.Schlottmann, K., Wachs, F. P., Krieg, R. C., Kullmann, F., Scholmerich, J., and Rogler, G. (2000) Cancer Res. 60, 4270-4276 [PubMed] [Google Scholar]
- 3.Powell, A. A., LaRue, J. M., Batta, A. K., and Martinez, J. D. (2001) Biochem. J. 356, 481-486 [DOI] [PMC free article] [PubMed] [Google Scholar]
- 4.Park, S. E., Choi, H. J., Yee, S. B., Chung, H. Y., Suh, H., Choi, Y. H., Yoo, Y. H., and Kim, N. D. (2004) Int. J. Oncol. 25, 231-236 [PubMed] [Google Scholar]
- 5.Milovic, V., Teller, I. C., Faust, D., Caspary, W. F., and Stein, J. (2002) Eur. J. Clin. Investig. 32, 29-34 [DOI] [PubMed] [Google Scholar]
- 6.Hague, A., Elder, D. J. E., Hicks, D. J., and Paraskeva, C. (1995) Int. J. Cancer 60, 400-406 [DOI] [PubMed] [Google Scholar]
- 7.Haza, A. I., Glinghammar, B., Grandien, A., and Rafter, J. (2000) Nutr. Cancer 36, 79-89 [DOI] [PubMed] [Google Scholar]
- 8.Shiraki, K., Ito, T., Sugimoto, K., Fuke, H., Inoue, T., Miyashita, K., Yamanaka, T., Suzuki, M., Nabeshima, K., Nakano, T., and Takase, K. (2005) Int. J. Mol. Med. 16, 729-733 [PubMed] [Google Scholar]
- 9.Wachs, F. P., Krieg, R. C., Rodrigues, C. M. P., Messmann, H., Kullmann, F., Knuchel-Clarke, R., Scholmerich, J., Rogler, G., and Schlottmann, K. (2005) Int. J. Color. Dis. 20, 103-113 [DOI] [PubMed] [Google Scholar]
- 10.Payne, C. M., Crowley-Weber, C. L., Dvorak, K., Bernstein, C., Bernstein, H., Holubec, H., Crowley, C., and Garewal, H. (2005) Cell Biol. Toxicol. 21, 215-231 [DOI] [PubMed] [Google Scholar]
- 11.Payne, C. M., Weber, C., Crowley-Skillicorn, C., Dvorak, K., Bernstein, H., Bernstein, C., Holubec, H., Dvorakova, B., and Garewal, H. (2007) Carcinogenesis 28, 215-222 [DOI] [PubMed] [Google Scholar]
- 12.Reddy, B. S. (1992) Lipids 27, 807-813 [DOI] [PubMed] [Google Scholar]
- 13.Reddy, B. S. (1975) Cancer 36, 2401-2406 [DOI] [PubMed] [Google Scholar]
- 14.Bernstein, H., Bernstein, C., Payne, C. M., Dvorakova, K., and Garewal, H. (2005) Mutat. Res. 589, 47-65 [DOI] [PubMed] [Google Scholar]
- 15.Debruyne, P. R., Bruyneel, E. A., Li, X. D., Zimber, A., Gespach, C., and Mareel, M. M. (2001) Mutat. Res. 480, 359-369 [DOI] [PubMed] [Google Scholar]
- 16.Tan, K. P., Yang, M., and Ito, S. (2007) Mol. Pharmacol. 72, 1380-1390 [DOI] [PubMed] [Google Scholar]
- 17.Becker, S., Reinehr, R., Grether-Beck, S., Eberle, A., and Haussinger, D. (2007) Biol. Chem. 388, 185-196 [DOI] [PubMed] [Google Scholar]
- 18.Reinehr, R., Becker, S., Keitel, V., Eberle, A., Grether-Beck, S., and Haussinger, D. (2005) Gastroenterology 129, 2009-2031 [DOI] [PubMed] [Google Scholar]
- 19.Sokol, T. J., Dahl, R., Devereaux, M. W., Yerushalmi, B., Kobak, G. E., and Gumpricht, E. (2005) J. Pediatr. Gastroenterol. Nutr. 41, 235-243 [DOI] [PubMed] [Google Scholar]
- 20.Palmeira, C. M., and Rolo, A. P. (2004) Toxicology 203, 1-15 [DOI] [PubMed] [Google Scholar]
- 21.Rolo, A. P., Palmeira, C. M., Holy, J. M., and Wallace, K. B. (2004) Toxicol. Sci. 79, 196-204 [DOI] [PubMed] [Google Scholar]
- 22.Sola, S., Brito, M. A., Brites, D., Moura, J. J. G., and Rodrigues, C. M. P. (2002) Clin. Sci. 103, 475-485 [DOI] [PubMed] [Google Scholar]
- 23.Sokol, R. J., Straka, M. S., Dahl, R., Devereaux, M. W., Yerushalmi, B., Gumpricht, E., Elkins, N., and Everson, G. (2001) Pediatr. Res. 49, 519-531 [DOI] [PubMed] [Google Scholar]
- 24.Iizaka, T., Tsuji, M., Oyamada, H., Morio, Y., and Oguchi, K. (2007) Toxicology 241, 146-156 [DOI] [PubMed] [Google Scholar]
- 25.Reinehr, R., Becker, S., Wettstein, M., and Haussinger, D. (2004) Gastroenterology 127, 1540-1557 [DOI] [PubMed] [Google Scholar]
- 26.Reinehr, R., Graf, D., and Haussinger, D. (2003) Gastroenterology 125, 839-853 [DOI] [PubMed] [Google Scholar]
- 27.Higuchi, H., and Gores, G. J. (2003) Am. J. Physiol. 284, G734-G738 [DOI] [PubMed] [Google Scholar]
- 28.Qiao, L., Studer, E., Leach, K., McKinstry, R., Gupta, S., Decker, R., Kukreja, R., Valerie, K., Nagarkatti, P., El Deiry, W., Molkentin, J., Schmidt-Ullrich, R., Fisher, P. B., Grant, S., Hylemon, P. B., and Dent, P. (2001) Mol. Biol. Cell 12, 2629-2645 [DOI] [PMC free article] [PubMed] [Google Scholar]
- 29.Oh, S. H., Yun, K. J., Nan, J. X., Sohn, D. H., and Lee, B. H. (2003) Arch. Toxicol. 77, 110-115 [DOI] [PubMed] [Google Scholar]
- 30.Scotti, E., Gilardi, F., Godio, C., Gers, E., Krneta, J., Mitro, N., De Fabiani, E., Caruso, D., and Crestani, M. (2007) Cell. Mol. Life Sci. 64, 2477-2491 [DOI] [PMC free article] [PubMed] [Google Scholar]
- 31.Thomas, C., Auwerx, J., and Schoonjans, K. (2008) Thyroid 18, 167-174 [DOI] [PubMed] [Google Scholar]
- 32.Jean-Louis, S., Akare, S., Ali, M. A., Mash, E. A., Jr., Meuillet, E., and Martinez, J. D. (2006) J. Biol. Chem. 281, 14948-14960 [DOI] [PubMed] [Google Scholar]
- 33.Strupp, W., Weidinger, G., Scheller, C., Ehret, R., Ohnimus, H., Girschick, H., Tas, P., Flory, E., Heinkelein, M., and Jassoy, C. (2000) J. Membr. Biol. 175, 181-189 [DOI] [PubMed] [Google Scholar]
- 34.Katona, B. W., Cummins, C. L., Ferguson, A. D., Li, T., Schmidt, D. R., Mangelsdorf, D. J., and Covey, D. F. (2007) J. Med. Chem. 50, 6048-6058 [DOI] [PubMed] [Google Scholar]
- 35.Katona, B. W., Rath, N. P., Anant, S., Stenson, W. F., and Covey, D. F. (2007) J. Org. Chem. 72, 9298-9307 [DOI] [PubMed] [Google Scholar]
- 36.Landegren, U. (1984) J. Immunol. Methods 67, 379-388 [DOI] [PubMed] [Google Scholar]
- 37.Rolo, A. P., Oliveira, P. J., Moreno, A. J., and Palmeira, C. M. (2003) Mitochondrion 2, 305-311 [DOI] [PubMed] [Google Scholar]
- 38.Sokol, R. J., Devereaux, M., Dahl, R., and Gumpricht, E. (2006) J. Pediatr. Gastroenterol. Nutr. 43, (Suppl. 1) S4-S9 [DOI] [PubMed] [Google Scholar]
- 39.Fearnhead, H. O., Dinsdale, D., and Cohen, G. M. (1995) FEBS Lett. 375, 283-288 [DOI] [PubMed] [Google Scholar]
- 40.Chow, S. C., Weis, M., Kass, G. E., Holmstrom, T. H., Eriksson, J. E., and Orrenius, S. (1995) FEBS Lett. 364, 134-138 [DOI] [PubMed] [Google Scholar]
- 41.Faubion, W. A., Guicciardi, M. E., Miyoshi, H., Bronk, S. F., Roberts, P. J., Svingen, P. A., Kaufmann, S. H., and Gores, G. J. (1999) J. Clin. Investig. 103, 137-145 [DOI] [PMC free article] [PubMed] [Google Scholar]
- 42.Higuchi, H., Bronk, S. F., Takikawa, Y., Werneburg, N., Takimoto, R., El-Deiry, W., and Gores, G. J. (2001) J. Biol. Chem. 276, 38610-38618 [DOI] [PubMed] [Google Scholar]
- 43.Sodeman, T., Bronk, S. F., Roberts, P. J., Miyoshi, H., and Gores, G. J. (2000) Am. J. Physiol. 278, G992-G999 [DOI] [PubMed] [Google Scholar]
- 44.Khosravi-Far, R., and Esposti, M. D. (2004) Cancer Bio. Ther. 3, 1051-1057 [DOI] [PMC free article] [PubMed] [Google Scholar]
- 45.Kroemer, G., Galluzzi, L., and Brenner, C. (2007) Physiol. Rev. 87, 99-163 [DOI] [PubMed] [Google Scholar]
- 46.Gregoli, P. A., and Bondurant, M. C. (1999) J. Cell. Physiol. 178, 133-143 [DOI] [PubMed] [Google Scholar]
- 47.Thornberry, N. A., and Lazebnik, Y. (1998) Science 281, 1312-1316 [DOI] [PubMed] [Google Scholar]
- 48.Takizawa, T., Tatematsu, C., Ohashi, K., and Nakanishi, Y. (1999) Microbiol. Immunol. 43, 245-252 [DOI] [PubMed] [Google Scholar]
- 49.Graf, D., Kurz, A. K., Fischer, R., Reinehr, R., and Haussinger, D. (2002) Gastroenterology 122, 1411-1427 [DOI] [PubMed] [Google Scholar]
- 50.Heuman, D. M. (1995) Ital. J. Gastroenterol. 27, 372-375 [PubMed] [Google Scholar]
- 51.Sagawa, H., Tazuma, S., and Kajiyama, G. (1993) Am. J. Physiol. 264, G835-G839 [DOI] [PubMed] [Google Scholar]
- 52.Ridlon, J. M., Kang, D. J., and Hylemon, P. B. (2006) J. Lipid Res. 47, 241-259 [DOI] [PubMed] [Google Scholar]
- 53.Goncalves, A., Braguer, D., Carles, G., Andre, N., Prevot, C., and Briand, C. (2000) Biochem. Pharmacol. 60, 1579-1584 [DOI] [PubMed] [Google Scholar]
- 54.Krahenbuhl, S., Stucki, J., and Reichen, J. (1992) Hepatology 15, 1160-1166 [DOI] [PubMed] [Google Scholar]
- 55.Krahenbuhl, S., Talos, C., Fischer, S., and Reichen, J. (1994) Hepatology 19, 471-479 [DOI] [PubMed] [Google Scholar]
- 56.Reinehr, R., Becker, S., Eberle, A., Grether-Beck, S., and Haussinger, D. (2005) J. Biol. Chem. 280, 27179-27194 [DOI] [PubMed] [Google Scholar]
- 57.Yang, J. I., Yoon, J. H., Myung, S. J., Gwak, G. Y., Kim, W., Chung, G. E., Lee, S. H., Lee, S. M., Kim, C. Y., and Lee, H. S. (2007) Biochem. Biophys. Res. Commun. 361, 156-161 [DOI] [PubMed] [Google Scholar]
- 58.Biellmann, J. F. (2003) Chem. Rev. 103, 2019-2033 [DOI] [PubMed] [Google Scholar]
- 59.Richter, R. K., Mickus, D. E., Rychnovsky, S. D., and Molinski, T. F. (2004) Bioorg. Med. Chem. Lett. 14, 115-118 [DOI] [PubMed] [Google Scholar]
- 60.Westover, E. J., Covey, D. F., Brockman, H. L., Brown, R. E., and Pike, L. J. (2003) J. Biol. Chem. 278, 51125-51133 [DOI] [PMC free article] [PubMed] [Google Scholar]
- 61.VanLandingham, J. W., Cutler, S. M., Virmani, S., Hoffman, S. W., Covey, D. F., Krishnan, K., Hammes, S. R., Jamnongjit, M., and Stein, D. G. (2006) Neuropharmacology 51, 1078-1085 [DOI] [PubMed] [Google Scholar]
- 62.Green, P. S., Yang, S. H., Nilsson, K. R., Kumar, A. S., Covey, D. F., and Simpkins, J. W. (2001) Endocrinology 142, 400-406 [DOI] [PubMed] [Google Scholar]
- 63.Yi, K. D., Cai, Z. Y., Covey, D. F., and Simpkins, J. W. (2008) J. Pharmacol. Exp. Ther. 324, 1188-1195 [DOI] [PubMed] [Google Scholar]
- 64.Katona, B. W., Krishnan, K., Cai, Z. Y., Manion, B. D., Benz, A., Taylor, A., Evers, A. S., Zorumski, C. F., Mennerick, S., and Covey, D. F. (2008) Eur. J. Med. Chem. 43, 107-113 [DOI] [PubMed] [Google Scholar]
- 65.Alakoskela, J. M., Covey, D. F., and Kinnunen, P. K. J. (2007) Biochim. Biophys. Acta 1768, 131-145 [DOI] [PubMed] [Google Scholar]
- 66.Alakoskela, J. M., Sabatini, K., Jiang, X., Laitala, V., Covey, D. F., and Kinnunen, P. K. (2008) Langmuir 24, 830-836 [DOI] [PubMed] [Google Scholar]
Associated Data
This section collects any data citations, data availability statements, or supplementary materials included in this article.


