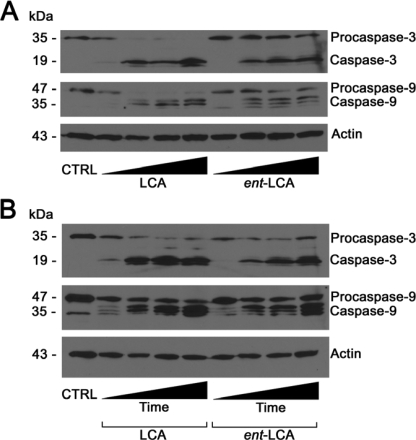
FIGURE 7.
Dose and time dependence of LCA and ent-LCA induced caspase activation in HT-29 cells. A, increasing concentrations (250, 375, 500, and 625 μm) of LCA and ent-LCA were applied for 4 h to HT-29 cells. B, 500 μm LCA and ent-LCA were applied for increasing amounts of time (1, 2, 4, and 8 h) to HT-29 cells. In all of the experiments, attached and detached cells were collected, and active and inactive caspase-3 and caspase-9 proteins were detected. CTRL, control.

