FIGURE 8.
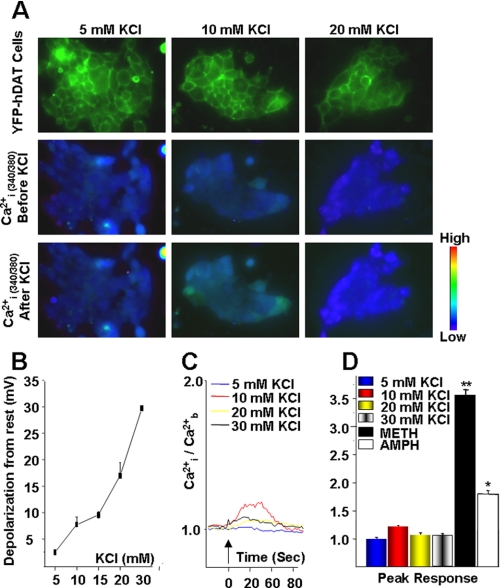
Membrane depolarization does not contribute to rise in [Ca2+]i. A, top panel is an image of YFP-DAT-expressing cells at time zero (t0) using a FITC HyQ filter cube. Middle and lower panels depict changes in internal free Ca2+ ([Ca2+]i), from a single representative experiment recorded at 0 s (middle panel) and ∼10 s (lower panel, peak response) after stimulation with 10 mm KCl. B, membrane potential changes as a function of external [KCl]. Cells were patched in the whole-cell configuration, and the membrane potentials were measured in varying levels of [KCl] (n = 3–5 cells for each KCl concentration). External solutions were controlled for osmolarity (see under “Materials and Methods”). C, representative quantitative increase in [Ca2+]i after stimulation with 5, 10, 20, and 30 mm KCl as shown in B as a function of time. The entire experiment was recorded for 5 min, and [Ca2+]i response was only seen immediately after KCl addition. Values were normalized to the average basal values ([Ca2+]b) for each independent experiment. D, bar graph represents peak [Ca2+]i responses observed at ∼10 s after stimulation with varying KCl concentrations (n = 31–64 cells of three independent experiments for each concentration) and compared with findings observed following stimulation with 10 μm AMPH or METH, p > 0.05 (see Fig. 6).

