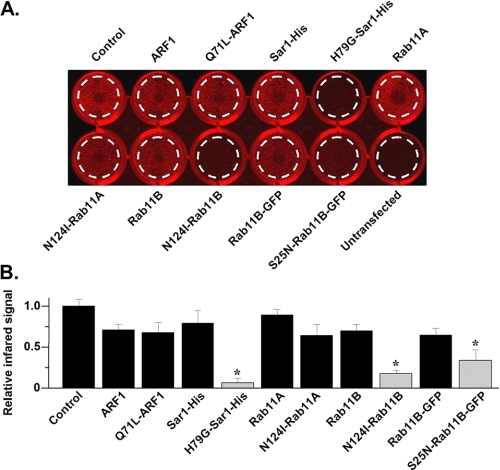
FIGURE 7.
Live cell Western recapitulates Western blot electrophysiological, and imaging data. A, representative image of the infrared signal emission signal from a 24-well tissue culture plate. Shown are twelve wells of confluent cells in control conditions, expressing WT or DN small GTPases, or untransfected cells. B, the relative mean infrared intensity for the live cell Western analyses is shown. The black bars represent control, or GTPases that did not significantly alter IhERG compared with control, whereas the shaded bars represent DN GTPases that significantly inhibited IhERG.

