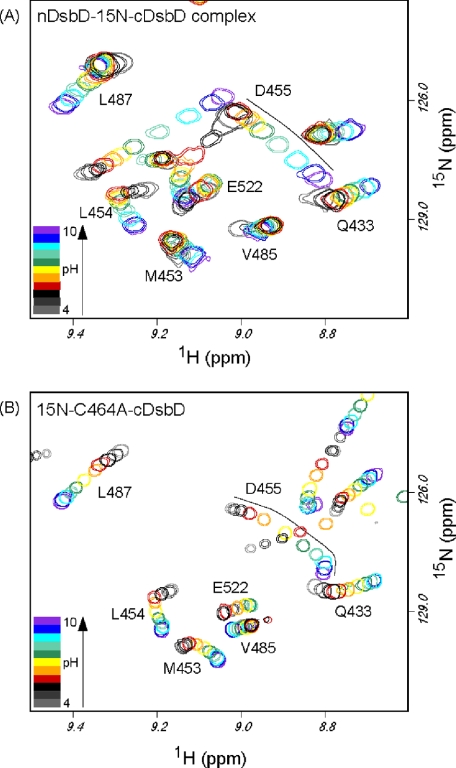
FIGURE 4.
Overlay of two-dimensional 1H-15N HSQC spectra of the nDsbD-15N-C464A-cDsbD complex (A) and 15N-C464A-cDsbD collected at 750 MHz and 313 K for pH values ranging from 4 to 10 (B). For the nDsbD-15N-C464A-cDsbD complex, spectra collected at pH 4.635 (light gray), 5.09 (dark gray), 5.73 (black), 6.57 (red), 7.165 (orange), 7.55 (yellow), 8.00 (green), 8.43 (blue-green), 8.845 (cyan), 9.32 (blue), and 9.755 (violet) are shown. For 15N-C464A-cDsbD, spectra collected at pH 4.36 (light gray), 4.895 (dark gray), 5.53 (black), 6.075 (red), 6.61 (orange), 7.21 (yellow), 7.685 (green), 8.155 (blue-green), 8.61 (cyan), 9.11 (blue), and 9.86 (violet) are shown. The black lines drawn in A and B trace the pH-dependent chemical shift changes observed for Asp455.

