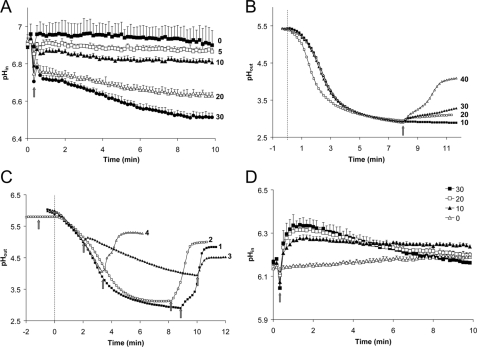
FIGURE 5.
Amiodarone induces cytosolic proton influx and medium alkalinization. A, cytoplasmic pH was monitored using the fluorescent pH indicator, pHluorin, expressed in WT (BY4742) yeast. Fluorescence emissions (410/485 nm) ratios were measured in response to amiodarone addition (0–30 μm; arrow), and pH was calculated after calibration as described under “Experimental Procedures.” Data are averaged from three independent experiments. B, extracellular pH was monitored following addition of 2% glucose (gray line; time 0). The arrow shows addition of amiodarone (10, 20, 30, and 40 μm). Data are representative of two independent experiments. C, effect of a pH gradient on amiodarone-mediated alkalinization was monitored as in B. Glucose was injected at gray line (time 0); arrows indicate addition of amiodarone (10 μm). D, cytoplasmic pH derived from fluorescence emissions (410/485 nm) ratios as described in A were measured in response to amiodarone addition (0–30 μm; arrow) in the absence of glucose. Data are averaged from three independent experiments.

