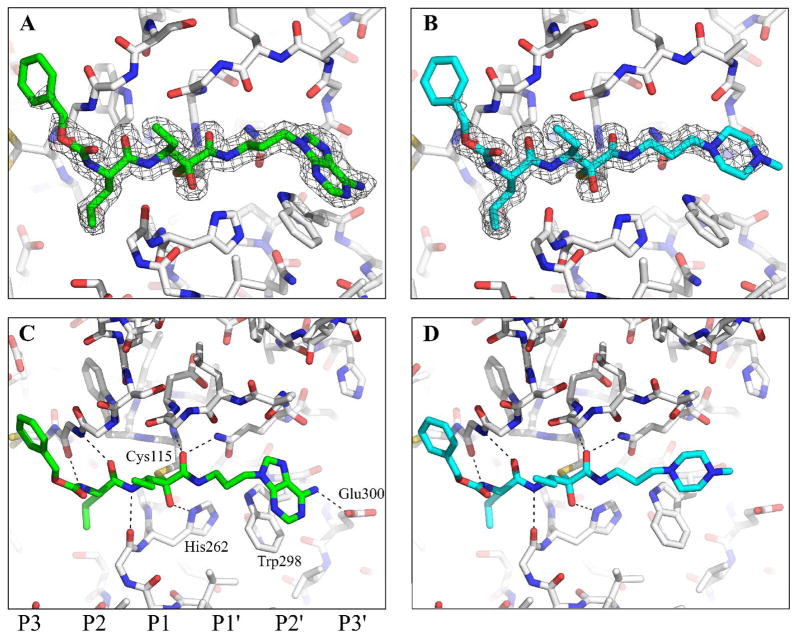
Figure 3.
Crystal structures of 1 and 2 bound to the active site of μI–II. The electron density of 1 (calculated with coefficients 2mFobs – DFcalc, φcalc and contoured at 1σ) and the inhibitor’s polar contacts with μI–II are shown in panels A & C, respectively, while those for 2 are shown in panels B & D. The carve feature of PyMOL33 was used to limit the display of electron density to a distance of 2 Å from the inhibitors. Bonds are colored by atom type: carbon=gray (μI–II), carbon = green (1), carbon = cyan (2), nitrogen = blue, oxygen = red, sulfur = orange. The peptide subsites are labelled below panel C.

