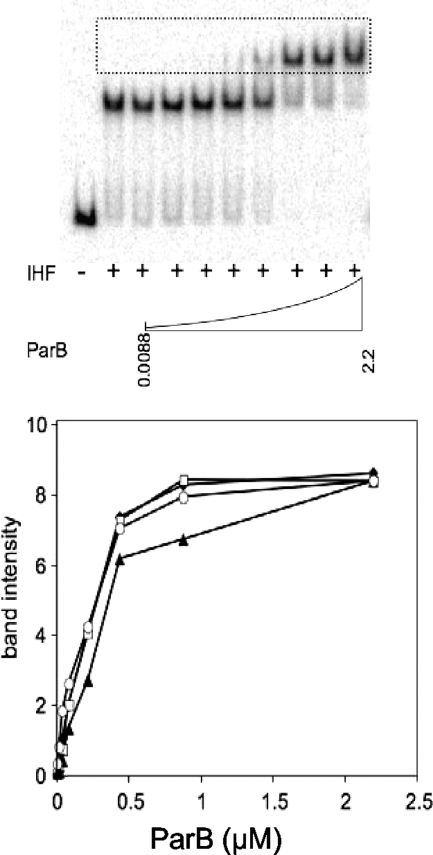
FIG. 3.
Gel mobility shift assays. (Top) Example of gel from the assay (P1 ParB wild-type protein bound to radioactively labeled DNA containing P7 parS). The dotted box shows the region of the gel scanned for the graph. (Bottom) Graph showing the band intensities from the boxed regions of gels. When present, reaction mixtures contained 18 nM IHF protein, the relevant labeled parS fragment, and the indicated level of ParB protein (μM). Black diamonds, P1 ParB wild type (P1 parS); open squares, P1 ParB(D288R) (P1 parS); black triangles, P1 ParB wild type (P7 parS); open ovals, P1 ParB(D288R) (P7 parS). The band intensity units are arbitrary. Duplicate experiments gave essentially the same result.

