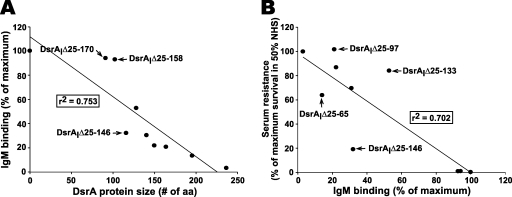
FIG. 5.
Correlations between the amounts of IgM bound at the surface of FX517 expressing truncated DsrA proteins and the sizes of the DsrA proteins (A) and between IgM binding and the serum resistance of strain FX517 expressing truncated DsrA proteins (B). Data from Fig. 4 were used to determine the correlations using Sigma Plot. For IgM binding and serum resistance, “maximum” refers to the amount of IgM bound at the surface of strain FX517 expressing DsrAI, which was defined as 100%.

