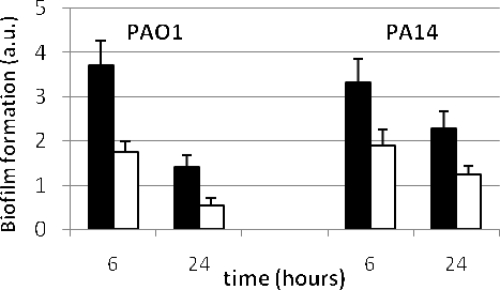
FIG. 4.
Biofilm formation by PAO1 and PA14 (black bars) and their pfpI mutant derivatives (white bars) after 6 and 24 h of incubation. The values represent arbitrary units (a.u.) of biofilm formation obtained by dividing the absorbance at 595 nm after crystal violet staining by the optical density of the cells prior to staining. The error bars represent standard deviations. The P values for comparisons between the wild-type strains and mutant derivatives (unpaired Student's t test) were below 0.001 for both 6 and 24 h.

