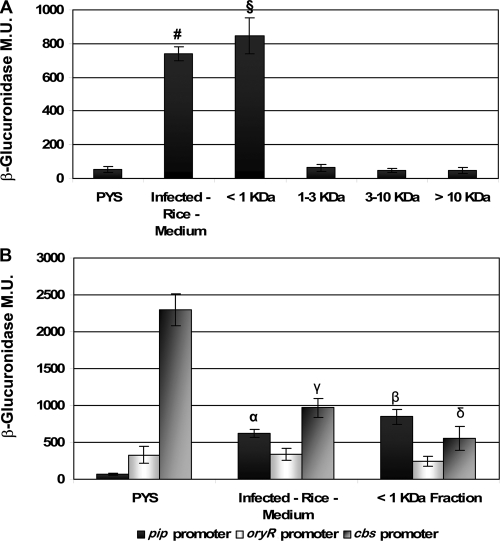
FIG. 5.
(A) pip promoter activity in X. oryzae pv. oryzae XKK.12(pPIP122) in rich medium in the presence of macerated rice or in different fractions of filtered macerated infected-rice medium. PYS, X. oryzae pv. oryzae with plasmid pPIP122 grown in rich PYS medium; Infected-Rice-Medium, X. oryzae pv. oryzae with plasmid pPIP122 grown in rice which was infected with X. oryzae pv. oryzae for 10 days prior to maceration; <1 KDa, X. oryzae pv. oryzae with plasmid pPIP122 grown in the presence of a filtrate from macerated rice that lacked all molecules larger than 1 kDa; 1-3 KDa, X. oryzae pv. oryzae with plasmid pPIP122 grown in the presence of a filtrate from macerated rice that included molecules with molecular masses ranging from 1 to 3 kDa; 3-10 KDa, X. oryzae pv. oryzae with plasmid pPIP122 grown in the presence of a filtrate from macerated rice that included molecules with molecular masses ranging from 3 to 10 kDa; >10 KDa, X. oryzae pv. oryzae with plasmid pPIP122 grown in the presence of a filtrate from macerated rice that included molecules with molecular masses larger than 10 kDa (see text for details). Promoter activity as determined by β-glucuronidase activity was detected only in the medium containing the <1-kDa fraction, indicating that the molecular mass of the RSM is less than 1 kDa. The results are expressed as means ± standard deviations (n = 3). §, P < 1.5 × 10⁻⁵ compared to the PYS value; #, P < 2 × 10⁻⁴ compared to the PYS value. Analyses in which the 1-3 KDa, 3-10 KDa, and >10 KDa values were compared to the PYS values revealed no statistically significant differences (P ≥ 0.05). (B) The pip promoter, oryR promoter, and cbsA promoter activities in the <1-kDa fraction were assayed and compared to the β-glucuronidase activities obtained for X. oryzae pv. oryzae with plasmid pPIP122 grown in rich PYS medium and for X. oryzae pv. oryzae with plasmid pPIP122 grown in rice which was infected with X. oryzae pv. oryzae for 10 days prior to maceration (see above). The results are expressed as means ± standard deviations (n = 3). α, P < 5.7 × 10⁻⁵ compared to the PYS value; β, P < 2.1 × 10⁻⁵ compared to the PYS value; γ, P < 8.3 × 10⁻⁵ compared to the PYS value; δ, P < 4 × 10⁻⁵ compared to the PYS value.

