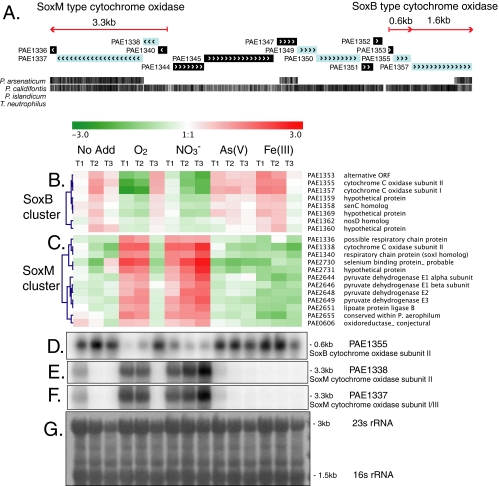
FIG. 1.
Genomic organization (A) and transcriptional expression (B to F) of aerobic SoxM-type and SoxB-type cytochrome oxidase genes in P. aerophilum. The red arrows in panel A indicate transcripts detected by Northern analysis (D to F). Individual genes are shown in shaded boxes, with arrow marks indicating the predicted direction of transcription. The black hatch marks at the bottom of panel A indicate regions of nucleotide sequence similarity in multiple genome alignments with other Pyrobaculum species and show an extended region of similarity in the aerobe P. calidifontis. Hierarchically clustered microarray gene expression profiles for SoxB cytochrome oxidase genes (B) and for SoxM cytochrome oxidase genes (C) during time courses of growth on different terminal electron acceptors are shown (No Add, no terminal electron acceptor added). Positive (red) and negative (green) changes in gene expression are shown on a log2 scale, with the scale bar shown at the top. Expression values for each time course represent the average log2 ratio of three replicate respiratory induction experiments. The blue dendrograms show relationships based on complete linkage clustering using the Pearson correlation. Northern analyses of the SoxB-type cytochrome oxidase (D) and the SoxM-type cytochrome oxidase genes (E and F), with lanes corresponding to sample growth conditions indicated above the heat maps, are shown. (G) Methylene blue stain of total RNA showing 23S and 16S rRNA bands on a representative blot used for Northern analysis.

